
S. Kootar1,2,3,*, M.H. Huque1,2,3,*, R. Eramudugolla1,2,3, D. Rizzuto5,6, M.C. Carlson7, M.C. Odden8, O.L. Lopez9,10, C. Qiu5, L. Fratiglioni5,6, S.D. Han11,12, D.A. Bennett12, R. Peters1,2,3,4, K.J. Anstey1,2,3
1. School of Psychology, Matthews Building, University of New South Wales, Kensington, NSW, 2033, Australia; 2. Neuroscience Research Australia, Barker Street, Randwick, NSW, 2031, Australia; 3. UNSW Ageing Futures Institute, University of New South Wales, Kensington, NSW 2033, Australia; 4. School of Public Health, Imperial College, London, Exhibition Road, South Kensington, London SW 2AZ, UK; 5. Aging Research Center, Department of Neurobiology, Care Sciences and Society, Karolinska Institutet-Stockholm University, Stockholm, Sweden; 6. Stockholm Gerontology Research Center, Stockholm, Sweden; 7. Department of Mental Health, Johns Hopkins Bloomberg School of Public Health, and Johns Hopkins Center on Aging and Health, Baltimore, MD, United States; 8. Department of Epidemiology & Population Health, Stanford School of Medicine, Palo Alto, CA, United States; 9. Department of Neurology, University of Pittsburgh, Pittsburgh, PA, United States; 10. Department of Psychiatry, University of Pittsburgh, Pittsburgh, PA, United States; 11. Department of Family Medicine, Keck School of Medicine of the University of Southern California, Los Angeles, CA United States; 12. Rush Alzheimer’s Disease Center, Rush University Medical Center, Chicago, IL, United States; *Equal first author
Corresponding Author: Scientia Professor Kaarin J. Anstey, School of Psychology, University of New South Wales, Kensington NSW 2052, Australia, Telephone no: +61 9399 1061, Email: k.anstey@unsw.edu.au
J Prev Alz Dis 2023;3(10):478-487
Published online April 11, 2023, http://dx.doi.org/10.14283/jpad.2023.38
Abstract
BACKGROUND: Lack of external validation of dementia risk tools is a major limitation for generalizability and translatability of prediction scores in clinical practice and research.
OBJECTIVES: We aimed to validate a new dementia prediction risk tool called CogDrisk and a version, CogDrisk-AD for predicting Alzheimer’s disease (AD) using cohort studies.
DESIGN, SETTING, PARTICIPANTS AND MEASUREMENTS: Four cohort studies were identified that included majority of the dementia risk factors from the CogDrisk tool. Participants who were free of dementia at baseline were included. The predictors were component variables in the CogDrisk tool that include self-reported demographics, medical risk factors and lifestyle habits. Risk scores for Any Dementia and AD were computed and Area Under the Curve (AUC) was assessed. To examine modifiable risk factors for dementia, the CogDrisk tool was tested by excluding age and sex estimates from the model.
RESULTS: The performance of the tool varied between studies. The overall AUC and 95% CI for predicting dementia was 0.77 (0.57, 0.97) for the Swedish National study on Aging and Care in Kungsholmen, 0.76 (0.70, 0.83) for the Health and Retirement Study – Aging, Demographics and Memory Study, 0.70 (0.67,0.72) for the Cardiovascular Health Study Cognition Study, and 0.66 (0.62,0.70) for the Rush Memory and Aging Project.
CONCLUSIONS: The CogDrisk and CogDrisk-AD performed well in the four studies. Overall, this tool can be used to assess individualized risk factors of dementia and AD in various population settings.
Key words: Dementia, Alzheimer’s disease, risk tool, accuracy, prediction, ROC curve.
Introduction
Currently, over 55 million people live with dementia worldwide and the number of cases are projected to increase to 78 million by 2030 (1). This, along with unsuccessful clinical trials on dementia treatment, has led to urgent calls for dementia prevention. As the evidence of both risk factors and effective risk reduction interventions is increasing, there is a need to implement findings in policy and practice. Hence, there is a need for accurate risk assessment tools to be leveraged by clinicians, researchers, policy makers, and the general population to support the implementation of dementia risk reduction programs.
Several dementia and Alzheimer’s disease (AD) risk models have been developed in community settings (2-5). Systematic reviews (6-8) have compared different prediction models based on mid- and late-life age groups, variables included, follow-up time of dementia diagnosis, study setting, and the discriminative accuracy of the tools to predict dementia and its subtypes. However, direct comparisons are limited due to the different methodologies used for tool development and different target samples and outcomes. Few of these prediction models have been translated into practical tools. The needs of a tool for implementing dementia risk reduction in practice should inform prevention strategies and not be considered from a purely statistical perspective. Studies reporting high Area Under the Curve values (AUC) for risk tools typically include disease indicators that are not independent of disease onset such as memory loss, imaging biomarkers, or genetics which are not modifiable or widely accessible (9). In contrast, our aim was to develop a tool that informs preventive action and can be widely applicable. Of the available risk assessment tools that similarly focus on providing preventive information, two have been developed from more than one dataset. The Brief Dementia Screening Index (BDSI) (10), was developed from four international cohort studies, and the ANU-Alzheimer’s Disease Risk Index (ANU-ADRI) (3), was developed using an evidence-based synthesis approach which collated data from various countries and is available online. Two other tools, the Cardiovascular Risk Factors, Aging and Dementia (CAIDE) (4) and the Lifestyle for Brain Health (LIBRA) (5), have been developed from single studies but validated on several cohorts and have been developed into apps. The evidence base has progressed substantially since the development of dementia risk tools such as CAIDE and ANU-ADRI (11, 12). Recently, cardiovascular disease (CVD) risk estimates using SCORE2 (a risk tool for CVD) was shown to predict all cause dementia in the UK Biobank (13).
To incorporate the newest evidence on dementia risk factors into a practical tool, we recently developed the CogDrisk tool for predicting dementia, and a version of the tool for specifically predicting AD called CogDrisk-AD (14). This tool incorporates risk and protective factors identified through systematic synthesis of the latest evidence base and selects predictors of dementia and AD based on strength of evidence as well as availability of measures that are practicable in a range of clinical and research contexts. To our knowledge, the CogDrisk includes the largest number of modifiable risk factors and incorporates age group and sex differences. Lack of external validation of risk tools is a major limitation for generalizability and translatability of prediction scores in clinical practice and research. Therefore, in this study, we aim to validate the CogDrisk tool within four international studies to evaluate how well they predict Any Dementia and AD in different populations. Once validated, the tool may be used by clinicians, the public, and policy makers to assess level of risk in individuals or communities and to guide specific feedback for dementia risk reduction.
Methods
Validation cohorts
We shortlisted datasets through database searches, review of consortia, consultation with experts, and then evaluated them in terms of the outcome measures, i.e., availability of clinical diagnosis of dementia, inclusion of majority of risk and protective factors measured in the CogDrisk assessment tool (refer Supplementary Information 1 Part B), and long follow-up time (average of more than 5 years) for AD and dementia. Four cohorts were available that met our criteria and are briefly described below. We also considered the Framingham Heart Study (FHS) but there was a large difference in age (midlife for FHS versus late-life for other studies) and a far earlier timeframe (1975 compared with late 19th to 20th century) of baseline assessment between this and the other studies. We decided to exclude the FHS to avoid differences while comparing the validation results. Supplementary Information 1 Table A1 describes the study characteristics, number and age of study participants, follow-up scheme, the criteria used for diagnosing dementia and AD.
The Swedish National study on Aging and Care in Kungsholmen (SNAC-K) (15)
The SNAC-K study was initiated in 2001-2004 (baseline), and comprised 3,363 participants aged 60 years and above. In our analysis, we have included 3,122 participants, where exclusions were due to dementia at baseline (n=241). At baseline, the mean age was 73·6 years and 36·6% of the participants were male.
The Health and Retirement Study – Aging, Demographics and Memory Study (HRS ADAMS) (16)
The HRS ADAMS is a supplementary study in the HRS (17) that conducted in-person clinical assessments to gather information on cognitive status. The study consisted of 856 community-based individuals aged 70 years and above who were assessed in 2001 (baseline) and followed through to 2008. The mean age of participants at baseline was 81·6 years and 41·5% were male.
The Cardiovascular Health Study Cognition Study (CHS-CS) (18)
The CHS-CS was an ancillary study of the main Cardiovascular Health Study. The CHS-CS was initiated in 1991-1994 and was followed up until 1999-2000 with 3,602 community-based participants who had a cerebral MRI and Modified Mini-Mental State Examination (3MSE) (19). In our analysis, participants with dementia at baseline were excluded (n=227) leaving 3,375 participants. At baseline, the mean age was 74·8 years and 40·9% were male.
The Rush Memory and Aging Project (MAP) (20, 21)
The MAP comprised 2,184 participants aged 60 years and older who undertook the baseline examination in 1997-1998 and were followed annually for up to 22 years at the time of these analyses. The participant’s mean age at baseline was 80·0 years and 26·5% were males.
Data harmonization and coding of predictors
Data harmonization was carried out across studies using a common scoring system to standardize the measure of the variables (refer to Supplementary Information 1 Tables B1-B17 for details). Selection of predictors, their definition and coding have been described previously (14). The predictors used in this validation study are based on the component variables included in the CogDrisk assessment tool and details are described in the Supplementary Information 1 Part B. Seventeen risk/protective factors were identified for inclusion in the algorithm to estimate the risk of Any Dementia including age, sex, education, mid-life obesity, high cholesterol and hypertension, diabetes, stroke, traumatic brain injury (TBI), atrial fibrillation, insomnia, depression, physical inactivity, cognitive and social engagement, fish intake, and smoking. The CogDrisk-AD tool had similar risk factors included with the omission of atrial fibrillation and insomnia due to insufficient evidence that these factors are associated with an increased risk of AD, and the inclusion of pesticide exposure in CogDrisk-AD. We could not include pesticide exposure in the validation of the CogDrisk-AD model as this variable was not available in the validation cohorts.
Statistical analysis
The accuracy of the statistical models for identifying participants at risk of dementia and AD using the CogDrisk score was quantified by calculating the AUC and associated 95% confidence interval (22). To exclusively check the effect of modifiable risk factors, the predictive accuracy of the proposed CogDrisk score was further evaluated without age and sex for both dementia and AD. We also evaluated the predictive ability of mid-life risk factors on late-life dementia with data included from mid-life participants (40 to 65 years) across all cohorts, where available.
The CogDrisk score was calculated by adding points allocated to individual risk/protective factors. The methodology for the scoring system has been described previously (14). Briefly, risk algorithms were developed for dementia and AD by first converting relative risk ratios (described in detail in the development of CogDrisk manuscript (14)) to points that were added to form a risk score. Conditional equations were specified for risk factors that only had an effect in midlife (high cholesterol, obesity and overweight, and hypertension).
Not all risk/protective factors were measured at baseline in the validation cohorts (Table 1). In such cases, measures were taken from visits closest to the baseline under the assumption that the specific characteristics were constant over time (see Supplementary Information 1 Table C1). To assess the impact of missing data we ran two different sensitivity analyses including (i) a reduced model by removing risk/protective factors with a large number of missing observations (ranging from 24% to 79·7%) which improved the sample sizes, and (ii) multiple imputations. To carry out multiple imputations, we excluded participants missing education status or who had missing data for more than five covariates (exclusions: 30 in SNAC-K, five in HRS-ADAMS and CHS-CS, and eight in MAP). We considered 20 imputed datasets (equivalent to the proportion of missing data in most covariates) following fully conditional specifications/imputations by chained equations (23). In the multiple imputation models, appropriate covariates were chosen to ensure compatibility between the imputation and analysis model. All analyses were conducted using Stata statistical software: release 16·0 (StataCorp, College Station, Texas, USA).
Results
Baseline characteristics of participants in the four studies
Table 1 shows the baseline characteristics of the four validation samples. Out of the 17 risk/protective factors included in the CogDrisk score, SNAC-K had the most risk/protective factors (16) followed by MAP (14), CHS-CS (12), and HRS ADAMS had the fewest (11) risk/protective factors. Mid-life BMI and mid-life hypertension measurements were available in MAP and SNAC-K studies. Age, sex, education, diabetes, stroke, and smoking status measures were available in all four cohorts.
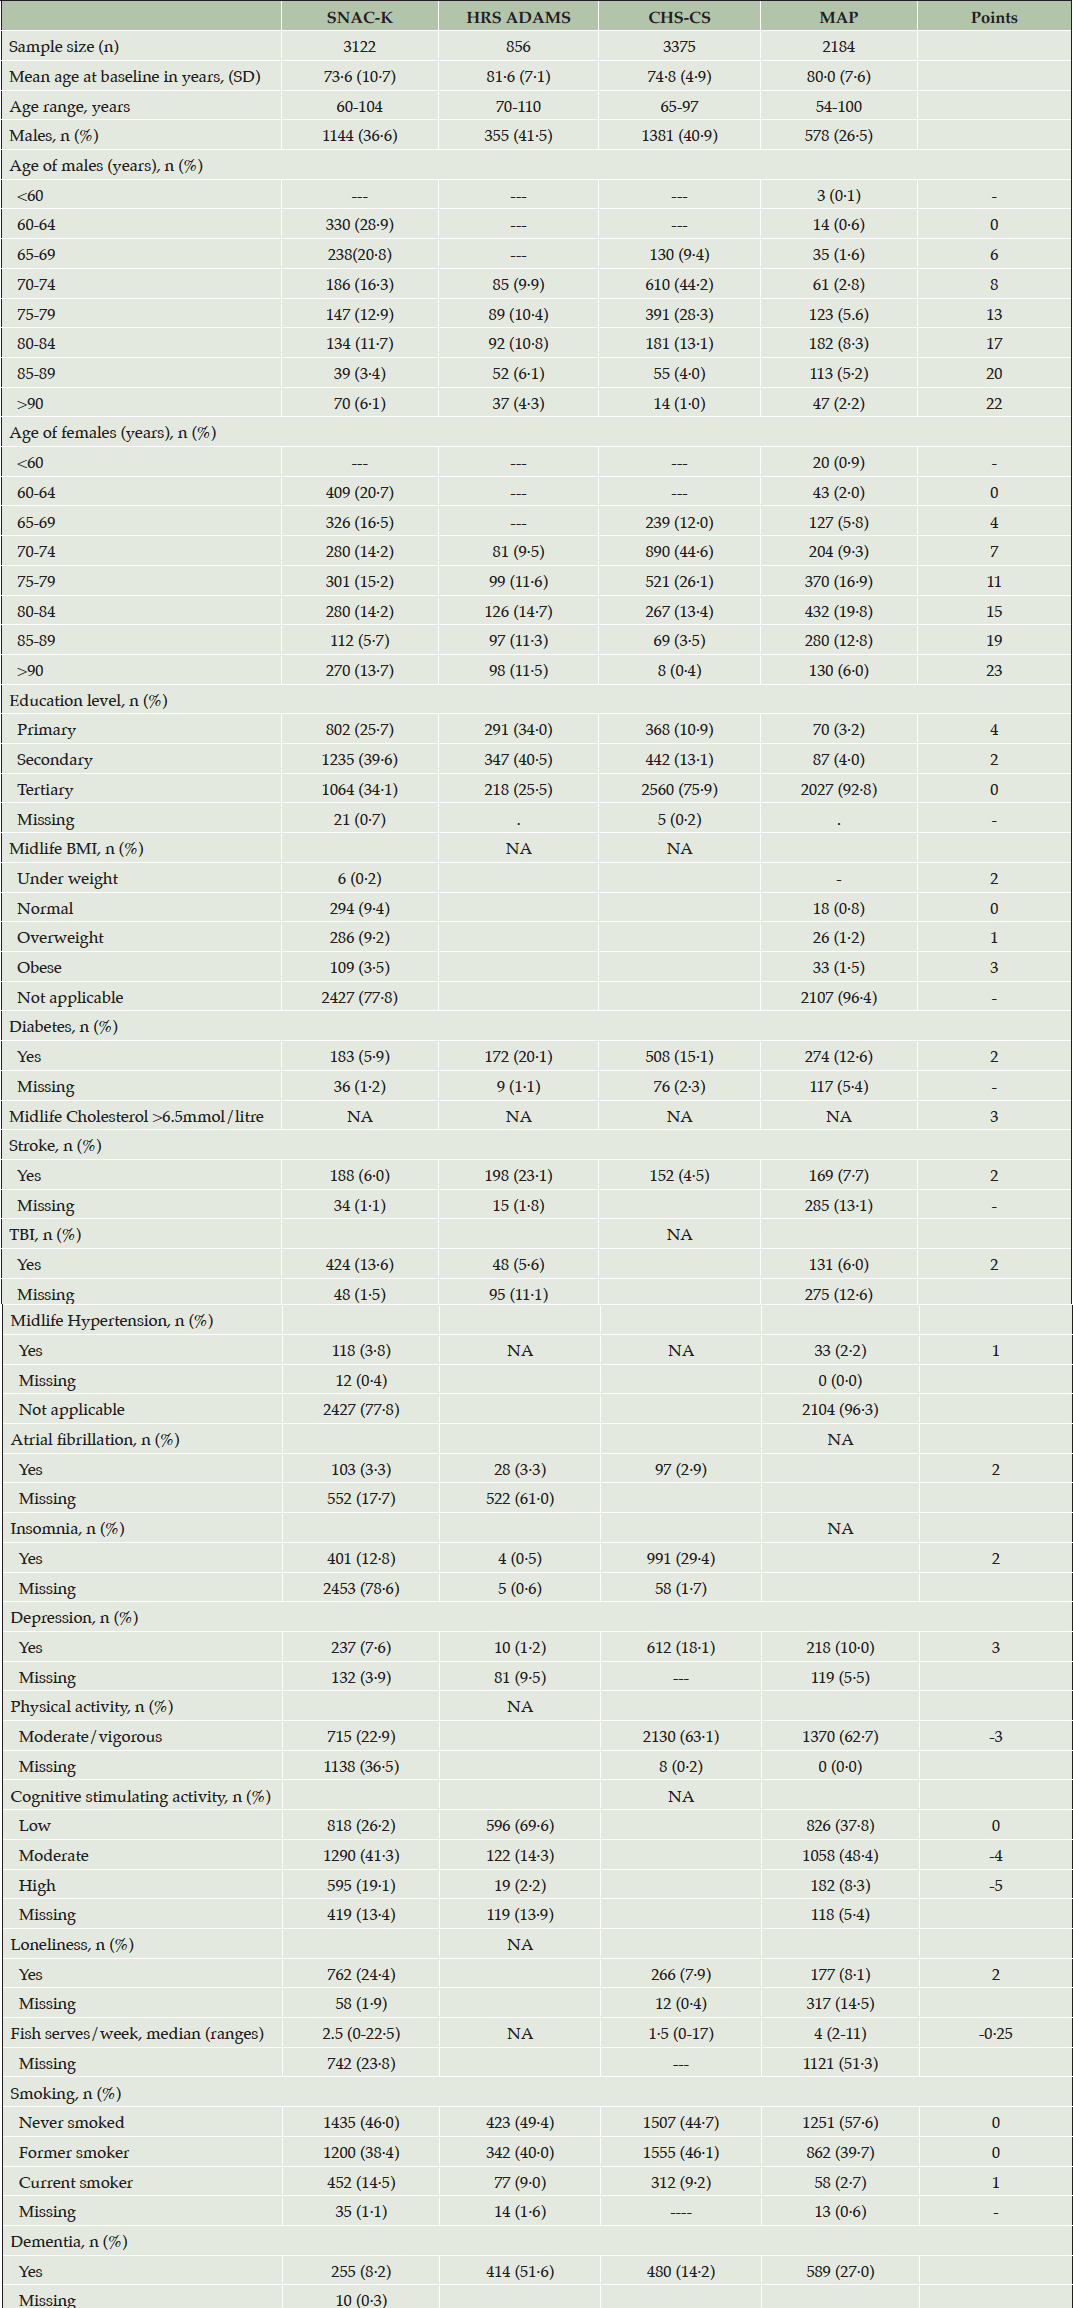
Table 1. Descriptive statistics for the four evaluation cohorts, their measured risk and protective factors, and the points allocated to each factor on CogDrisk
Abbreviations: TBI: Traumatic brain injury; BMI: Body mass index
The average age of the participants across all cohorts was 70 years and above. In all the studies, females comprised a greater proportion of the sample as compared to males, especially in the MAP (73·5%) and SNAC-K (63·4%). Tertiary education was lowest in HRS ADAMS (25·5%) followed by SNAC-K (34.1%) while MAP had the highest proportion of participants with tertiary education (92·8%). Each study differed in the prevalence of several risk factors. Missing data in risk/protective factors are reported in Table 1. The points attributed to each of the risk and protective factors are also reported in Table 1. The number of incident dementia cases available in these datasets were 255 (7·6%) for SNAC-K (baseline: 2001-2004, followed through till 2018), 414 (51·6%) for HRS ADAMS (baseline: 2001-2003 followed till 2008-2009), 480 (14·2%) for CHS-CS (baseline:1991-1994, followed up till 1998-1999) and 589 (27%) for MAP (baseline: 1997-1998, followed through till 2020).
Performance of the CogDrisk tool across the studies
The application of the CogDrisk scores on various datasets including both sexes and missing data in risk/protective factors resulted in good AUC (0·77; 95%CI: 0·57, 0·97) for SNAC-K, (0·76; 95% CI: 0·70,0·83) for HRS ADAMS, and (0·70; 95%CI: 0·67, 0·72) for CHS-CS to moderate AUC (0·66, 95% CI: 0·62, 0·70) for MAP (refer Table 2). For males, the AUC was highest for HRS ADAMS followed by CHS-CS, SNAC-K, and MAP. For females, highest AUC was observed when the CogDrisk score was applied to the SNAC-K followed by HRS ADAMS, CHS-CS, and MAP (refer Table 2 for AUCs). Overall, we observed good performance of the CogDrisk score when applied to SNAC-K, HRS ADAMS and CHS-CS.
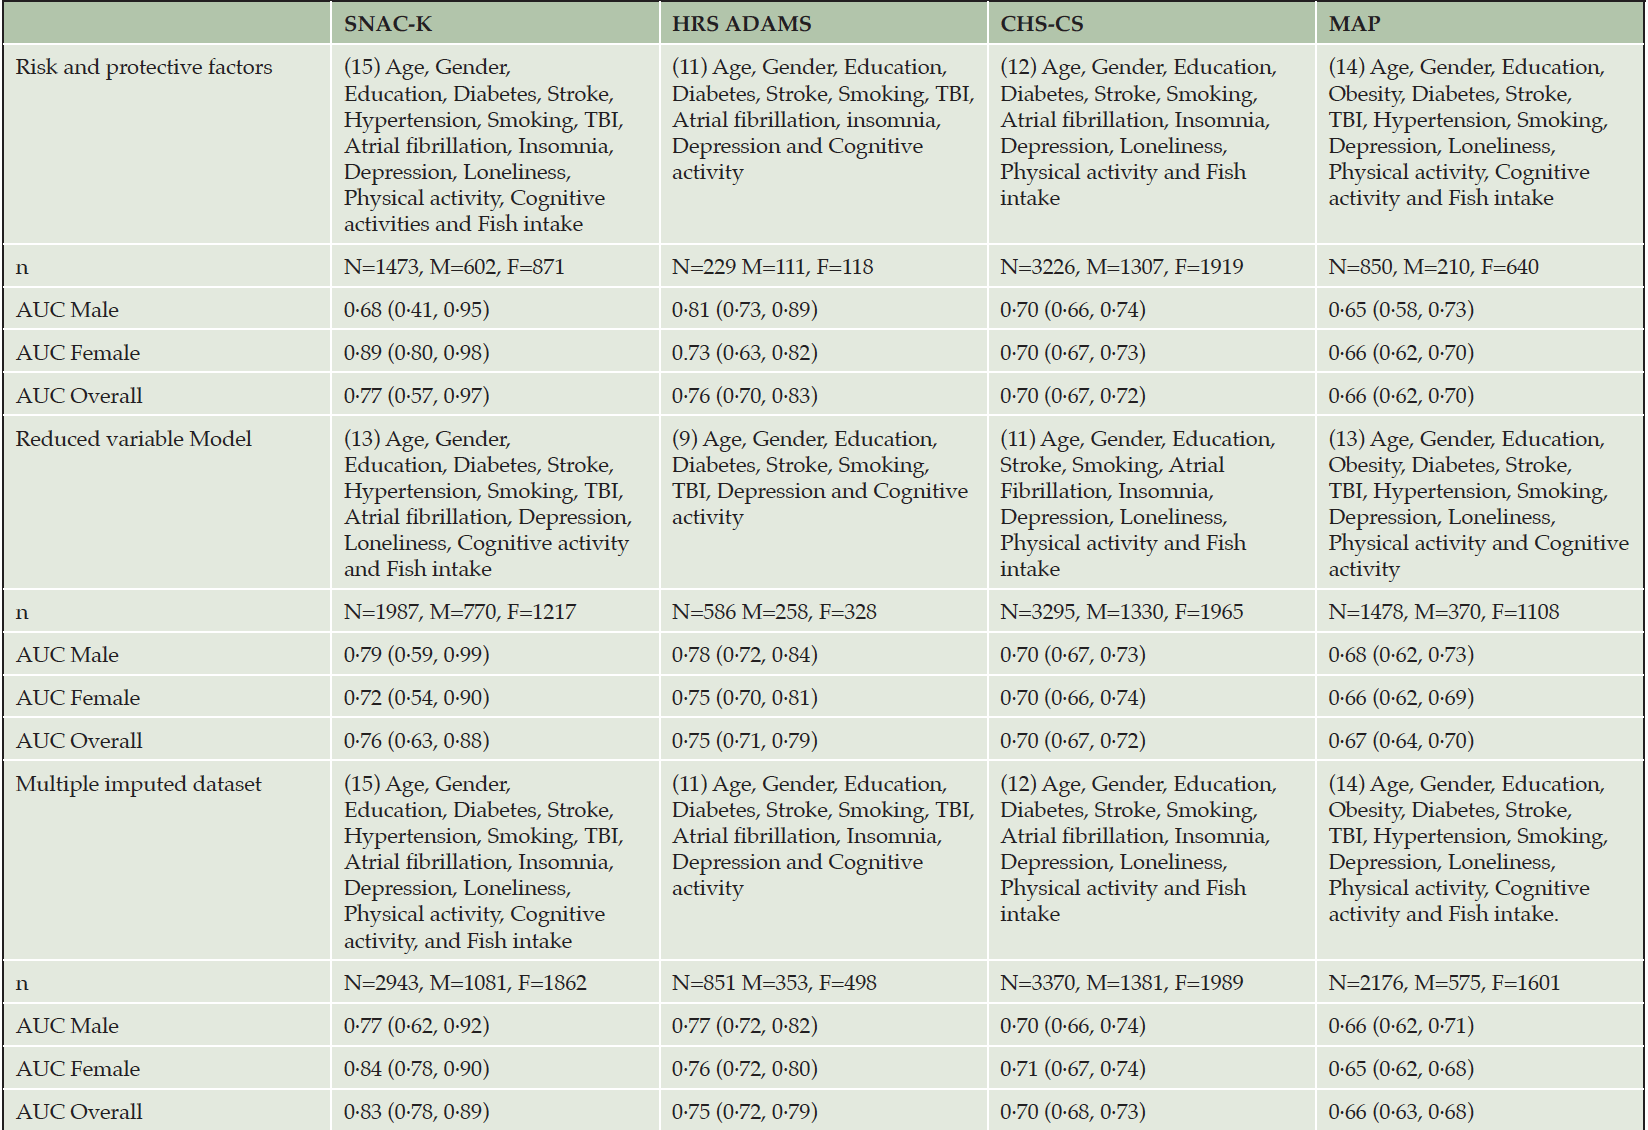
Table 2. Parameters of CogDrisk for predicting dementia in the four cohort studies
Abbreviations: TBI: Traumatic brain injury
Sensitivity analysis
To assess the impact of missing data on the discriminatory performance of the CogDrisk score, we evaluated the CogDrisk score on the reduced variable model and using multiple imputations with all the available variables. Although the sample size improved, the resulting AUC was similar when variables were dropped from studies, i.e., when physical activity was dropped from SNAC-K, atrial fibrillation and insomnia from HRS ADAMS, TBI from CHS-CS and fish intake from MAP (refer Table 2). To evaluate the application of CogDrisk to midlife, CogDrisk was also validated in participants less than 65 years of age at baseline, where available (refer Table 4). Obesity and hypertension were only evaluated for midlife participants as the evidence for these risk factors relates only to midlife. Midlife participants were available in SNAC-K (n=736) and MAP (n=80), with six, and two cases respectively. We used similar methodology to apply the CogDrisk score to these subsets of cohorts as in the full cohorts. As the number of incident dementia cases were low, the performance of the CogDrisk score for midlife was poor, i.e., 0·51 (95% CI: 0·27,0·75) for SNAC-K. There was a slight improvement in AUCs with multiple imputations on the respective datasets (see Table 4).
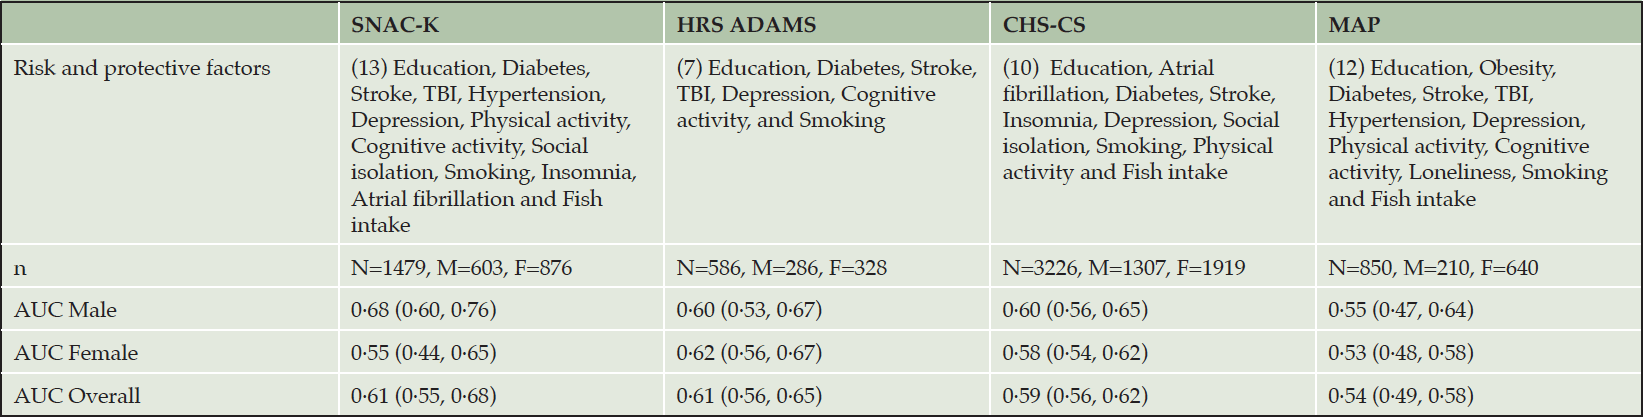
Table 3. Parameters of CogDrisk without age and gender for predicting dementia in the four cohort studies
Abbreviations: TBI: Traumatic brain injury
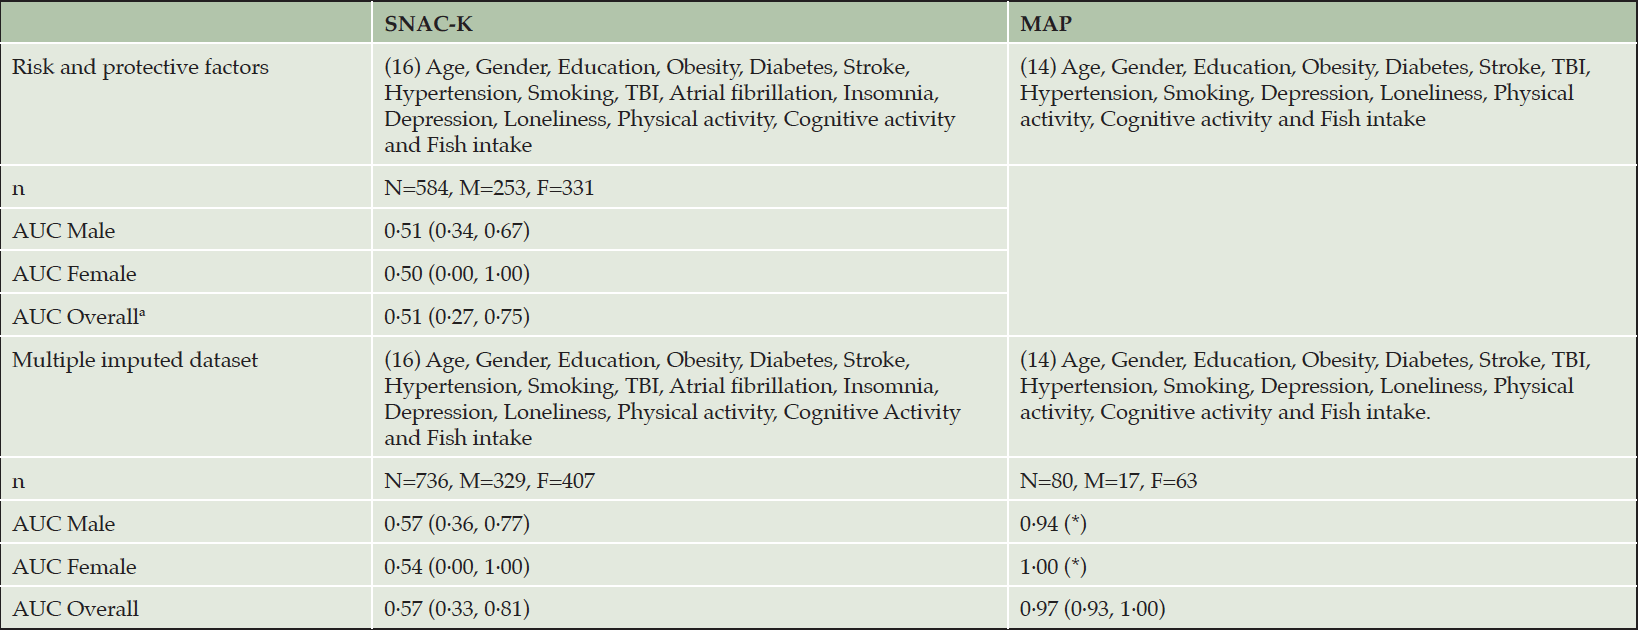
Table 4. Parameters of CogDrisk for predicting dementia in midlife participants from SNAC-K and MAP studies
*Standard error not available. Abbreviations: TBI: Traumatic brain injury
Characteristics and accuracy of CogDrisk without age and gender estimates for predicting dementia
As age and sex are non-modifiable risk factors for dementia, we also assessed the performance of the CogDrisk score without age and sex estimates. The resulting AUCs (95% CI) are 0·61 (0·55, 0·68) for SNAC-K, 0·61 (0·56, 0·65) for HRS ADAMS, 0·59 (0·56, 0·62) for CHS-CS, and 0·54 (0·49, 0·58) for MAP (see Table 3).
Performance of CogDrisk-AD score in predicting Alzheimer’s disease across the studies
We also evaluated the validity of the CogDrisk-AD score in all the four datasets to assess the predictive ability for Alzheimer’s disease (using the diagnosis provided by the constituent cohorts) (refer Table 5). Specifically, the CogDrisk-AD score performed the best when applied to the HRS ADAMS and CHS-CS data, followed by SNAC-K, and MAP. When the CogDrisk score was defined based on a reduced set of variables and using multiple imputed datasets, this reduced CogDrisk performed similarly to the full model that included covariates with missing data (refer Table 5).
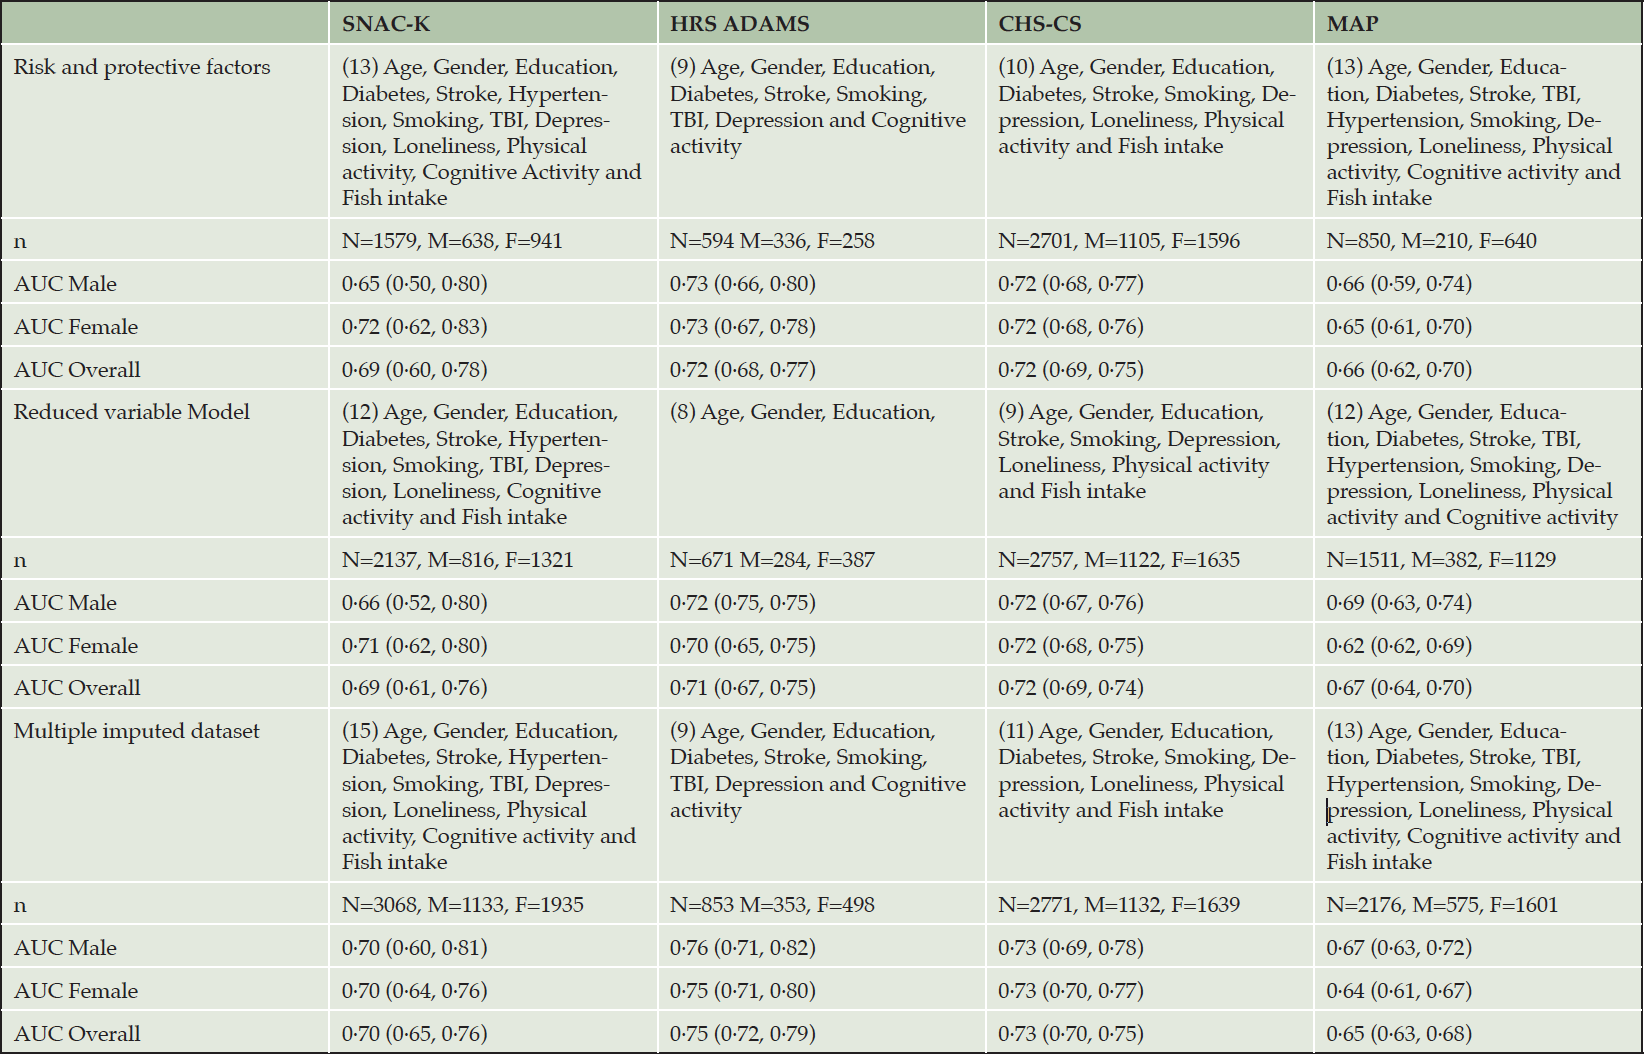
Table 5. Parameters of CogDrisk-AD for predicting Alzheimer disease in the four cohort studies
Abbreviations: TBI: Traumatic brain injury
Discussion
In this study, we externally validated the CogDrisk on four high-quality cohort studies. Our results indicate that the CogDrisk has adequate predictive ability for dementia and AD in late-life adults and is of comparable accuracy to other risk tools that have been developed to inform preventive actions (4, 5, 24). Overall, our findings demonstrate that the CogDrisk tool can be used to assess individualized risk factors of dementia and AD in various population settings.
On externally evaluating the CogDrisk, we found that the AUCs varied between the studies with the best predictive performance in the SNAC-K and HRS ADAMS followed by, CHS-CS, and MAP. There are two potential reasons for the variation in the AUCs. Firstly, there is a difference in the mean age of the participants at baseline with HRS ADAMS and MAP having higher mean age as compared to CHS-CS and SNAC-K. Secondly, studies differed in the number and prevalence of predictors available in their datasets.
A study by Licher et al. (2018) compared different dementia risk models and identified age as a major contributing factor for dementia occurrence while other risk factors had marginal contributions (25). On analysing the model without age and sex, the AUCs were reduced for all studies with HRS ADAMS, SNAC-K, and CHS-CS maintaining an adequate predictive ability. In clinical practice, knowledge of areas where individuals can reduce risk is more important than non-modifiable factors such as age and sex.
The CogDrisk did not perform well with midlife participants probably due to the low number of incident dementia cases in these samples. Further testing of the tool on larger datasets with midlife participants is underway. Risk scores for mid- and late-life adults can be used as surrogate outcomes for mid- and late-life dementia preventive interventions.
We found that the CogDrisk was predictive of Any Dementia and that the CogDrisk-AD version was predictive of AD. The CogDrisk-AD may be useful for clinical trials focussing on AD, and to guide risk reduction advice for individuals at increased risk of AD due to family history or having an APOE ε4 genotype.
This study has several strengths. The CogDrisk tool was assessed on four studies, for two outcomes, in both mid and late-life participants. To our knowledge, this is the most extensive validation conducted on any dementia risk assessment tool. The external validation samples include two countries from four different datasets, bringing in different population characteristics and, supporting the generalizability of the instrument. The tool is cost-effective because the measures are self-reported which will enable it to be used in universal health initiatives and by clinicians. The CogDrisk tool also has the potential to inform patient and health practitioners in targeting specific risk factors for individuals thus providing personalized advice in clinical settings. It includes a wider range of factors than that captured by tools that focus on cardiovascular risk factors such as SCORE2. Given the overlap in risk and protective factors of dementia with other chronic diseases, a single predictive tool for dementia and other conditions may be efficient in clinical practice. Our team is working to evaluate which such risk prediction models can be developed.
Our study has some limitations. Firstly, not all variables were available in the existing datasets to calculate the full CogDrisk score. In practice, the CogDrisk tool is available online and so all factors can be easily assessed. Secondly, though we harmonised the measures of the predictors between studies there is some variability in the measurement of risk factors across studies, for example, questions measuring moderate and vigorous physical activities. The addition of new literature to the field since earlier tools were developed has extended the number of modifiable risk factors but not led to noticeably larger AUCs. Our interpretation is that our findings demonstrate the upper limit of what is possible for low-cost, convenient dementia risk assessment when validating using cohort study data. Measurement of individual risk factors involves a degree of error and lack of specificity of clinical thresholds where patients or clinicians endorse binary responses. Co-occurrence of risk factors within individuals may also in part explain the limit on AUC that can be reached in developing practical dementia risk tools. Finally, the long prodromal period of dementia, means that unless a cohort study has followed every participant to completion, there will be undetected cases of preclinical dementia or individuals who will ultimately develop dementia who do not obtain a diagnosis during the observation period. This reduces the accuracy of predictive models.
We conclude that the CogDrisk is a valid assessment tool that predicts dementia and AD. It incorporates a large number of modifiable risk factors for dementia that are available in a range of clinical and research contexts making the tool practical and available to use for dementia prevention interventions. The CogDrisk tool can be used by clinicians, researchers, policy makers and the public for identifying individuals at risk for dementia and monitoring risk reduction efforts.
Funding: This research was funded by a NeuRA Grant to KJA, the NHMRC Dementia Collaborative Research Centre, and NHMRC GNT1171279. KJA is funded by Australian Research Council Fellowship FL190100011, SK is funded by NHMRC GNT1171279. CQ is partly funded by grants from the Swedish Research Council (grant no.: 2020-01574), the Swedish Foundation for International Cooperation in Research and Higher Education (STINT) (grant no.: CH2019-8320), and Karolinska Institutet, Stockholm, Sweden. LF received grants from the Swedish Research Council (grant no.: 2017-06088) and the Swedish Research Council for Health, Working Life and Welfare (grant no.: 2016-07175). MAP is supported by NIA grant R01AG17917. MAP data can be requested at https://www.radc.rush.edu. Open Access funding enabled and organized by CAUL and its Member Institutions
Acknowledgements: The Swedish National study on Aging and Care, SNAC, (www.snac.org) is financially supported by the Ministry of Health and Social Affairs, Sweden, the participating County Councils and Municipalities, and the Swedish Research Council. The Cardiovascular Health Study (CHS) research was supported by contracts HHSN268201200036C, HHSN268200800007C, HHSN268201800001C, N01HC55222, N01HC85079, N01HC85080, N01HC85081, N01HC85082, N01HC85083, N01HC85086, 75N92021D00006, and grants U01HL080295 and U01HL130114 from the National Heart, Lung, and Blood Institute (NHLBI), with additional contribution from the National Institute of Neurological Disorders and Stroke (NINDS). Additional support was provided by R01AG023629 from the National Institute on Aging (NIA). A full list of principal CHS investigators and institutions can be found at CHS-NHLBI.org. The content is solely the responsibility of the authors and does not necessarily represent the official views of the National Institutes of Health. This manuscript has been reviewed by CHS for scientific content and consistency of data interpretation with previous CHS publications. The HRS is sponsored by the National Institute on Aging (grant number NIA U01AG009740) and is conducted by the University of Michigan. We would thank the study participants and staff of the Rush Alzheimer’s Disease Centre for providing MAP data.
Conflict of interest disclosure: SDH is an advisor to Staying Sharp. MCC is a member of the AARP Scientific Advisory Board. There are no other conflicts of interest.
Availability of data and materials: Data from the HRS ADAMS, CHS-CS, and MAP datasets are publicly available. We obtained approval to access these from the data custodians. As the SNAC-K data could not be transferred, DR carried out the analysis on our behalf. These data cannot be shared with other investigators.
Ethics approval and consent to participate: Ethical approval for this project was obtained from the UNSW Human Research Ethics Committee (Protocols # HC200108, HC200331, 3349). Each cohort study was approved by its Institutional Review Board. Informed consent was obtained by each study for all participants.
Author’s contribution: SK and HH are equal first authors. KJA developed the initial plan for the development of the CogDrisk tool and its validation. SK, HH, RE, RP, KJA developed the analysis plan, and study design including application to different cohort studies. SK identified cohort studies, reviewed the literature and prepared the original draft of the manuscript. SK, KJA and HH contributed to harmonisation of the risk data. HH conducted the data analysis and interpretation and also contributed to the writing. SK has directly accessed the data and verified the variables used in the analysis during the data harmonization process. DR conducted the analysis of validating the CogDrisk on the SNAC-K study. MC was the sponsor for the CHS-CS study, CQ and LF for the SNAC-K, SDH for the MAP study. All authors provided critical revisions and approval was given on the final version of the manuscript to be published.
Open Access: This article is distributed under the terms of the Creative Commons Attribution 4.0 International License (http://creativecommons.org/licenses/by/4.0/), which permits use, duplication, adaptation, distribution and reproduction in any medium or format, as long as you give appropriate credit to the original author(s) and the source, provide a link to the Creative Commons license and indicate if changes were made.
References
1. Gauthier S, Rosa-Neto P, Morais J, Webster C. World Alzheimer Report 2021: Journey through the diagnosis of dementia. Alzheimer’s Disease International: London, UK. 2021
2. Capuano AW, Shah RC, Blanche P, Wilson RS, Barnes LL, Bennett DA, et al. Derivation and validation of the Rapid Assessment of Dementia Risk (RADaR) for older adults. PLoS One. 2022;17(3):e0265379 (10.1371/journal.pone.0265379).
3. Anstey KJ, Cherbuin N, Herath PM. Development of a new method for assessing global risk of Alzheimer’s disease for use in population health approaches to prevention. Prev Sci. 2013;14(4):411-21 (10.1007/s11121-012-0313-2).
4. Kivipelto M, Ngandu T, Laatikainen T, Winblad B, Soininen H, Tuomilehto J. Risk score for the prediction of dementia risk in 20 years among middle aged people: a longitudinal, population-based study. Lancet Neurol. 2006;5(9):735-41
5. Schiepers OJG, Kohler S, Deckers K, Irving K, O’Donnell CA, van den Akker M, et al. Lifestyle for Brain Health (LIBRA): a new model for dementia prevention. Int J Geriatr Psychiatry. 2018;33(1):167-75 (10.1002/gps.4700).
6. Hou XH, Feng L, Zhang C, Cao XP, Tan L, Yu JT. Models for predicting risk of dementia: a systematic review. J Neurol Neurosurg Psychiatry. 2019;90(4):373-9 (10.1136/jnnp-2018-318212).
7. Stephan BC, Tang E, Muniz-Terrera G. Composite risk scores for predicting dementia. Curr Opin Psychiatry. 2016;29(2):174-80 (10.1097/YCO.0000000000000235).
8. Tang EY, Harrison SL, Errington L, Gordon MF, Visser PJ, Novak G, et al. Current Developments in Dementia Risk Prediction Modelling: An Updated Systematic Review. PLoS One. 2015;10(9):e0136181 (10.1371/journal.pone.0136181).
9. You J, Zhang YR, Wang HF, Yang M, Feng JF, Yu JT, et al. Development of a novel dementia risk prediction model in the general population: A large, longitudinal, population-based machine-learning study. EClinicalMedicine. 2022;53:101665 (10.1016/j.eclinm.2022.101665).
10. Barnes DE, Beiser AS, Lee A, Langa KM, Koyama A, Preis SR, et al. Development and validation of a brief dementia screening indicator for primary care. Alzheimers Dement. 2014;10(6):656-65 e1 (10.1016/j.jalz.2013.11.006).
11. Yu JT, Xu W, Tan CC, Andrieu S, Suckling J, Evangelou E, et al. Evidence-based prevention of Alzheimer’s disease: systematic review and meta-analysis of 243 observational prospective studies and 153 randomised controlled trials. J Neurol Neurosurg Psychiatry. 2020;91(11):1201-9 (10.1136/jnnp-2019-321913).
12. Anstey KJ, Ee N, Eramudugolla R, Jagger C, Peters R. A Systematic Review of Meta-Analyses that Evaluate Risk Factors for Dementia to Evaluate the Quantity, Quality, and Global Representativeness of Evidence. J Alzheimer’s Dis. : JAD. 2019;70(s1):S165-s86 (10.3233/jad-190181).
13. Zheng F, Xie W, Li C, Gao D, Liang J. Prediction abilities of SCORE2 risk algorithms for incident dementia and all-cause mortality: results from the UK Biobank cohort study. J Gerontol A Bio Sci.: Series A. 2022
14. Anstey KJ, Kootar S, Huque MH, Eramudugolla R, Peters R. Development of the CogDrisk tool to assess risk factors for dementia. Alzheimers Dement (Amst). 2022;14(1):e12336 (10.1002/dad2.12336).
15. Lagergren M, Fratiglioni L, Hallberg IR, Berglund J, Elmstahl S, Hagberg B, et al. A longitudinal study integrating population, care and social services data. The Swedish National study on Aging and Care (SNAC). Aging Clin Exp Res. 2004;16(2):158-68 (10.1007/BF03324546).
16. Langa KM, Plassman BL, Wallace RB, Herzog AR, Heeringa SG, Ofstedal MB, et al. The Aging, Demographics, and Memory Study: study design and methods. Neuroepidemiology. 2005;25(4):181-91 (10.1159/000087448).
17. Health and Retirement Study (ADAMS) public use dataset. Produced and distributed by the University of Michigan with funding from the National Institute on Aging (grant number NIA U01AG009740). Ann Arbor, MI. 2009
18. Lopez OL, Kuller LH, Fitzpatrick A, Ives D, Becker JT, Beauchamp N. Evaluation of dementia in the cardiovascular health cognition study. Neuroepidemiology. 2003;22(1):1-12 (10.1159/000067110).
19. Teng EL, Chui HC. The Modified Mini-Mental State (3MS) examination. J Clin Psychiatry. 1987;48(8):314-8
20. Bennett DA, Schneider JA, Buchman AS, Mendes de Leon C, Bienias JL, Wilson RS. The Rush Memory and Aging Project: study design and baseline characteristics of the study cohort. Neuroepidemiology. 2005;25(4):163-75 (10.1159/000087446).
21. Bennett DA, Buchman AS, Boyle PA, Barnes LL, Wilson RS, Schneider JA. Religious Orders Study and Rush Memory and Aging Project. J Alzheimer’s Dis. 2018;64(s1):S161-S89 (10.3233/JAD-179939).
22. Zou KH, O’Malley AJ, Mauri L. Receiver-operating characteristic analysis for evaluating diagnostic tests and predictive models. Circulation. 2007;115(5):654-7 (10.1161/CIRCULATIONAHA.105.594929).
23. Huque MH, Carlin JB, Simpson JA, Lee KJ. A comparison of multiple imputation methods for missing data in longitudinal studies. BMC Med Res Methodol. 2018;18(1):168 (10.1186/s12874-018-0615-6).
24. Anstey KJ, Cherbuin N, Herath PM, Qiu C, Kuller LH, Lopez OL, et al. A self-report risk index to predict occurrence of dementia in three independent cohorts of older adults: the ANU-ADRI. PLoS One. 2014;9(1):e86141
25. Licher S, Yilmaz P, Leening MJ, Wolters FJ, Vernooij MW, Stephan BC, et al. External validation of four dementia prediction models for use in the general community-dwelling population: a comparative analysis from the Rotterdam Study. Eur J Epidemiol. 2018;33(7):645-55
© The Authors 2023