
C.J. Lansdall1, F. McDougall1, L.M. Butler1, P. Delmar1, N. Pross1, S. Qin2, L. McLeod2, X. Zhou2, G.A. Kerchner1, R.S. Doody1
1. F. Hoffmann-La Roche Ltd, Basel, Switzerland; 2. RTI Health Solutions, North Carolina, USA.
Corresponding Author: Claire Lansdall, F. Hoffmann-La Roche Ltd, Basel, Switzerland, Email: Claire.lansdall@roche.com
J Prev Alz Dis 2023;1(10):9-18
Published online December 8, 2022, http://dx.doi.org/10.14283/jpad.2022.102
Abstract
Background: Consensus is lacking on what constitutes a meaningful score change for individual patients on clinical outcome assessments (COAs) that are commonly used in clinical trials of Alzheimer’s disease. Such thresholds are one important approach to help contextualize trial results and demonstrate meaningful treatment benefit.
Objectives: To estimate meaningful within-patient change thresholds for the Clinical Dementia Rating Scale – Sum of Boxes (CDR-SB), Alzheimer’s Disease Assessment Scale – Cognitive Subscale (ADAS-Cog), and the Mini-Mental State Examination (MMSE) among participants with mild cognitive impairment (MCI).
Design: Retrospective anchor- and distribution-based analyses of data from the ADC-008 (NCT00000173) study were used to estimate thresholds for meaningful within-patient change on the target measures.
Setting: Analyses were conducted using data from ADC-008 a Phase III, multicenter, randomized, double-blind, placebo-controlled, parallel-group study among participants with the amnestic subtype of MCI, which was conducted by the Alzheimer’s Disease Cooperative Study (ADCS) between March 1999 and January 2004 in the United States and Canada.
Participants: Analyses were based on 769 eligible participants who completed the baseline assessment from 69 ADCS sites in the United States and Canada.
Measurements: The target outcome measures for this analysis included the CDR-SB, the ADAS-Cog, and the MMSE. The anchor measures for this analysis included the Global Deterioration Scale and the MCI–Clinical Global Impression of Change.
Results: Focusing on the 12-month time point, within-patient increases of 1–2.5 points in the CDR-SB and increases of 2–5 points on the 11-item ADAS-Cog and 13-item ADAS-Cog, on average, reflect minimal-to-moderate levels of deterioration, respectively.
Conclusions: These thresholds may be useful to aid the interpretation of Alzheimer’s disease clinical trial data by illustrating meaningful within-patient progression over the course of a clinical trial via supplementary progressor analyses, which may in turn be informative for treatment decisions. Estimates generated via these methods are specifically intended to evaluate within-patient change and are not intended to assess the magnitude and meaningfulness of differences between group-level changes over time.
Key words: Alzheimer’s disease, clinical outcome assessment, endpoint, mild cognitive impairment, meaningful change, clinically important, ADC-008.
Introduction
Clinical outcome assessments (COAs) of cognition and/or function, such as the Clinical Dementia Rating Scale (CDR), the Alzheimer’s Disease Assessment Scale – Cognitive Subscale (ADAS-Cog), and the Mini-Mental State Examination (MMSE), are commonly used in Alzheimer’s disease (AD) clinical trials to assess the efficacy of therapeutic interventions (1). Trial endpoints typically assess the statistical significance of changes from baseline in COA scores between treatment groups; however, supplementary approaches may be useful to convey meaningful clinical benefit at an individual patient level (2). One approach to demonstrate tangible within-patient benefit is to report the proportion of patients who meaningfully deteriorate (“progressor”) within treatment arms over the course of a study. This information may be useful to help convey the clinical relevance of a statistically significant treatment effect to key audiences, including PLWA (people living with AD) and their families, clinicians, healthcare regulators, and payers. However, consensus is lacking on what constitutes a clinically meaningful within-patient score change on COAs frequently used in AD clinical trials, and studies employing anchor- and distribution-based methods to define meaningful benefit are limited (2-6). Anchor-based methods are preferred by regulatory authorities, as they rely on a clinician’s, patient’s, or observer’s (often care partner’s) rating of meaningful decline on the selected anchor measure (e.g., a global outcome measure), in contrast to distribution-based methods that are based on statistical approaches alone (3, 5, 7).
In a workshop document (7) prepared as part of the development of the Patient Focused Drug Development guidance series (8), the US Food and Drug Administration (FDA) distinguished between thresholds used to define within-patient meaningful change and between-group minimum important difference. The FDA recommend that determining the clinical meaningfulness of a change is best determined at the individual level and have proposed methods to generate appropriate thresholds (7). Specifically, the “FDA recommends the use of anchor-based methods … to establish a threshold(s), or a range of thresholds, that would constitute a meaningful within-patient change score of the target COA… for the target patient population” (7). Importantly, they do not advocate for these thresholds to be applied to assess the clinical meaningfulness of a difference in mean score change between two treatment groups. “It is important to recognize that individual within-patient change is different from between group difference. The between-group difference is the difference in the score endpoint between two trial arms that is commonly used to evaluate treatment difference. Between-group differences do not address the individual within-patient change that is used to evaluate whether a meaningful score change is observed” (7).
Existing literature provides estimates of meaningful change for some standard AD measures (9-11), but the methods and terminology used for defining meaningful-change thresholds—also described as responder thresholds, within-patient meaningful changes, minimal clinically important differences, or minimal important differences—vary, and often do not specify whether thresholds pertain to the individual or group level. Estimates of meaningful change may also differ according to the stage of AD (12) and based on the sample from which they are estimated, which is important to consider when selecting an appropriate threshold to apply to a specific clinical trial population.
Most recently, Andrews et al. (12) employed anchor- and distribution-based methods to estimate thresholds of meaningful within-patient change as defined by clinician assessment of meaningful decline over, on average, a 1-year period in a large cohort of participants ranging from normal cognition to moderate-to-severe AD (clinical diagnosis, no biomarker confirmation). Clinicians rated whether a patient had observed a meaningful decline (yes/no) in memory, nonmemory cognitive abilities, behavior, ability to manage affairs, or motor/movement changes relative to previously attained abilities. It was assumed that the clinician’s assessment of a meaningful change was relative to the visit immediately preceding the time of evaluation. Estimates for within-patient meaningful deterioration generally increased with disease severity and ranged from 1- to 3-point decreases on the MMSE, 1- to 2-point increases in the CDR – Sum of Boxes (CDR-SB), and 3- to 5-point increases in the Functional Activities Questionnaire. There are some potential limitations of this type of analysis. Firstly, the use of a binary anchor meant that a threshold could only be determined for overall deterioration, rather than for different magnitudes of deterioration (i.e., a “minimal” vs “moderate” level of deterioration as determined by a clinician global rating based on observational interview). Additionally, the item on motor-related changes was used as part of the main anchor analysis. While motor changes can occur in AD, they are not considered core symptoms and therefore are more distal to the concept of interest (13).
The focus of the current study was to identify meaningful within-patient change thresholds to indicate meaningful progression among patients with mild cognitive impairment (MCI) using two candidate anchors: a clinician-rated retrospective change anchor and prospective severity anchor. In the context of this analysis, a progressor refers to a patient who has worsened by a magnitude indicative of meaningful deterioration on the COA of interest, specifically, the CDR-SB, the ADAS-Cog, and MMSE. This analysis adds to the growing literature on this important topic and provides robust within-patient estimates based on multiple anchors (prospective severity and retrospective change) and multiple levels of change (minimal and moderate), providing additional granularity beyond previous analyses.
Methods
Data source
Analyses were conducted using data from ADC-008 (NCT00000173), a Phase III, multicenter, randomized, double-blind, placebo-controlled, parallel-group study among participants with the amnestic subtype of MCI (14). ADC-008 was conducted by the Alzheimer’s Disease Cooperative Study (ADCS) between March 1999 and January 2004 in the United States and Canada with three arms to evaluate the efficacy of vitamin E or donepezil versus placebo over 3 years in reducing the rate of progression from MCI to AD. Key inclusion criteria of the ADC-008 study were an age of 55–90 years, an MMSE score of 24–30, a CDR Global Score of 0.5, and a Logical Memory delayed-recall score approximately 1.5–2 standard deviations (SDs) below an education-adjusted norm. While the study reported no statistically significant differences in progression to AD with vitamin E or donepezil relative to placebo during the 3-year study, prespecified analyses by 6-month treatment intervals showed a significant reduction in the likelihood of progression in the donepezil versus placebo groups during the first 12 months. ADC-008 was selected for this analysis because it included an appropriate participant population, two candidate anchor measures and the target outcomes of interest, and the data were publicly available. The main analyses included the complete study population.
Outcome measures
Target measures
The target outcome measures for this analysis included the CDR-SB, the ADAS-Cog, and the MMSE (Table S-1, Supplemental Appendix A). The CDR is used to assess cognitive and functional abilities in six domains, based on a semi-structured interview with the PLWA and an informant or care partner to stage dementia severity. The CDR yields both a global score (0–3) and a CDR-SB score (0–18) representing the sum score of the six domain ratings. Higher scores indicate greater severity/impairment (15,16). The ADAS-Cog is a performance-based assessment of cognitive function (17, 18). The 11-item ADAS-Cog (ADAS-Cog 11) includes 11 patient-completed tasks. The ADAS-Cog 11 total score ranges from 0–70; higher scores indicate greater dysfunction, and scores of at least 18 indicate cognitive impairment (17, 19, 20). The 13-item ADAS-Cog (ADAS-Cog 13) includes 13 tasks; the ADAS-Cog 13 total score for this modification ranges from 0–85 (21, 22). The MMSE is a 30-point clinician-rated screening instrument for distinguishing cognitively impaired people from cognitively unimpaired aging people and for monitoring cognitive changes in an individual over time. The MMSE total score ranges from 0–30; higher scores indicate better cognitive functioning (23).
Anchor measures
The anchor measures for this analysis included the Global Deterioration Scale (GDS) and the MCI–Clinical Global Impression of Change (MCI-CGIC) (Appendix A Table S-1). The GDS is a clinician-reported global impression of current cognitive functioning in people with primary degenerative dementia, including AD (24); scores range from 1 (no cognitive decline) to 7 (very severe cognitive decline [severe dementia]). The clinician-reported MCI-CGIC is a modified version of the commonly used ADCS-CGIC (25), for use in an MCI population. The MCI-CGIC is scored on a 7-point scale (1 = marked improvement to 7 = marked worsening) reflecting the patient’s overall change in cognitive, behavioral, and functional domains (26).
Analyses
An anchor-based approach was the primary method used to estimate thresholds for meaningful within-patient change on the target measures; supportive, distribution-based analyses are described in Supplemental Appendix B. Analyses were conducted on data at baseline, Months 6, 12, and 36. Responsiveness correlation analyses between change in the target measures and change in the anchor measures were conducted to evaluate the appropriateness of each candidate anchor. A correlation strength greater than or equal to 0.3 (27-29) is considered appropriate for anchor-based analyses. Anchor-based estimates based on descriptive statistics were calculated for all time points with responsiveness correlations at least 0.3, but greater weight was placed on the estimates from time points where stronger relationships were observed. In addition, estimates based on mixed models for repeated measures results were computed using all available data from Months 6, 12, and 36 to predict the endpoint changes based on the anchor changes. Least squares mean change scores of a target measure corresponding to a prespecified anchor level were estimated in mixed models for repeated measures using the change in a target COA as the dependent variable, an anchor measure as a categorical predictor, and time as a categorical covariate.
These anchor-based analyses were conducted to identify thresholds of meaningful score change (mainly based on mean or median score change on the CDR-SB from participant subgroups) associated with clinician-rated minimal and moderate levels of disease worsening/severity. Minimal worsening was anchored using the “minimal-worsening” category on the MCI-CGIC or a 1-point worsening from any category on the GDS. Moderate worsening was anchored using a “moderate-worsening” category on the MCI-CGIC or a 2-point worsening from any category on the GDS.
One-half SD at baseline, standard error of measurement, standard error of difference, and reliable change index were computed as supportive distribution-based estimates to quantify measurement error (see Supplemental Appendix B). Test-retest analysis was conducted to provide reliability estimates for the computation of standard error of measurement, standard error of difference, and reliable change index. Due to the study inclusion criterion (i.e., requirement of MMSE scores ≥ 24) and the limited baseline variability, these estimates for the MMSE should be considered with caution.
Finally, empirical cumulative distribution functions (CDFs) were presented to support the estimation of within-patient change thresholds. Empirical CDF plots optimally aid in evaluating the risk of misclassification of a chosen threshold; less overlap in the curves is preferred and indicates greater difference between the change score distributions of different anchor levels, hence greater ability of a chosen threshold to differentiate progressors and non-progressors. Supportive probability density functions (PDFs) also were plotted and are presented in Supplemental Appendix C.
Results
Participant characteristics
Analyses were based on 769 eligible participants who completed the baseline assessment from 69 ADCS sites in the United States and Canada (Table 1). The overall sample at baseline had an average (SD) age of 72.9 years (7.3 years); 46% were female and 55% carried one or more Apolipoprotein E ε4 allele. By the end of the study (Month 36), 296 participants were lost to follow-up, leaving 473 participants available for analyses across all time points. Compared with the total baseline population, the 473 participants with complete follow-up had a similar baseline age, though there was a slightly lower proportion of females (42%). By the end of the 3-year follow-up, 30% of the sample obtained CDR Global Scores > 0.5, indicating clinical progression (25% with a CDR Global Score of 1 indicating mild AD and 5% with a score of 2 indicating moderate AD), while 4% had CDR Global Scores of 0 at Month 36, indicating clinical improvement.
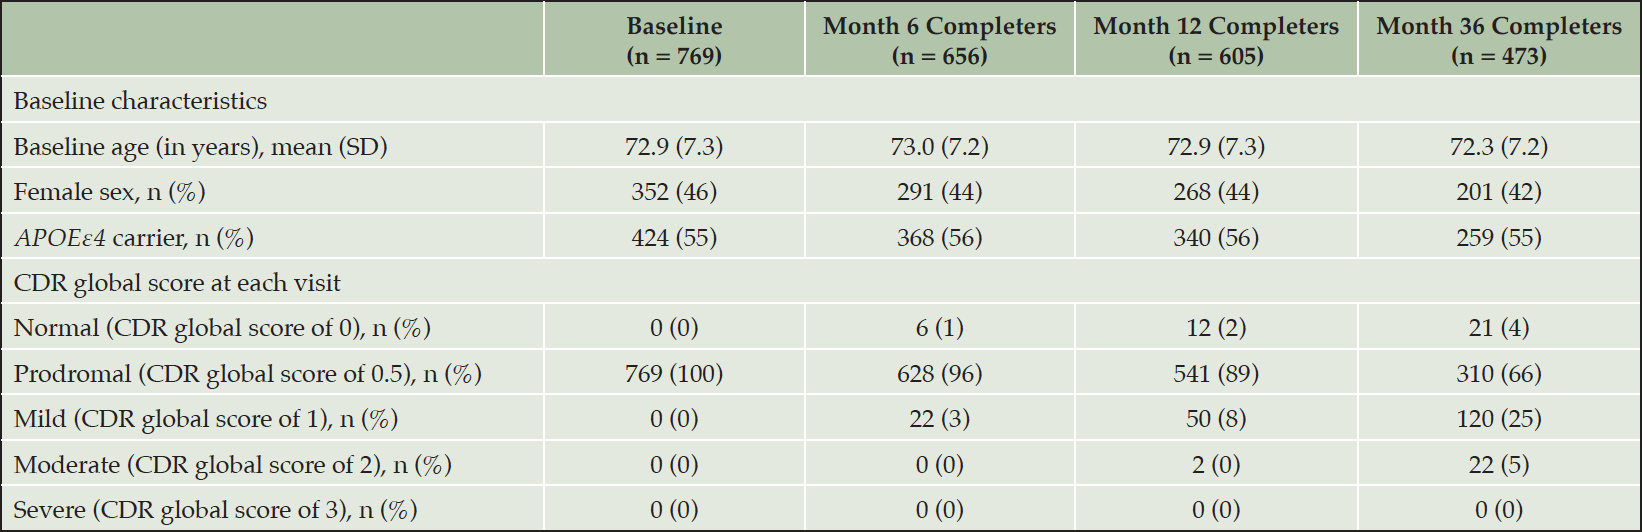
Table 1. Baseline characteristics and CDR Global Score
APOEε4 carrier status = presence of one or more apolipoprotein-E ε4 alleles; CDR = Clinical Dementia Rating Scale; SD = standard deviation. CDR-GS (range: 0–3; higher scores indicate greater severity).
Descriptive statistics and test-retest reliability for target measures
Overall, baseline scores on the target measures were indicative of a population with MCI. Some level of deterioration in scores on the CDR-SB, ADAS-Cog 11 and ADAS-Cog 13, and MMSE, indicative of disease progression, were observed for 61.5% of participants (473 of 769) remaining in the study at Month 36 (Table 2).
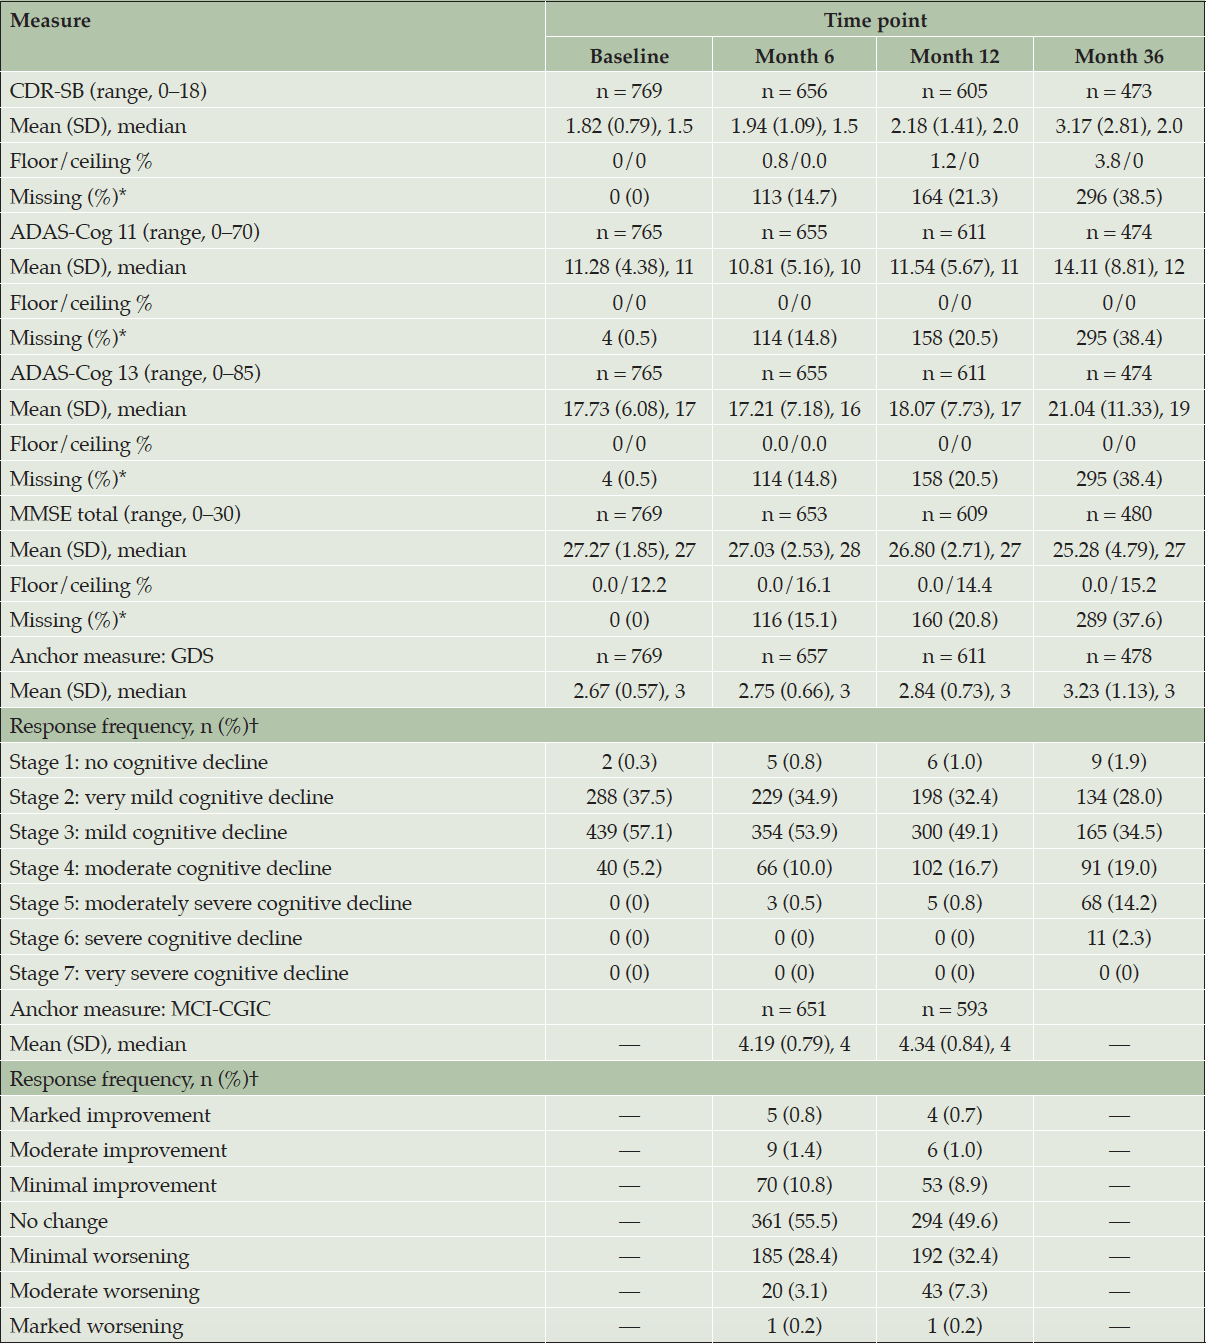
Table 2. Descriptive statistics of clinical outcome assessment measures
ADAS-Cog 11 = 11-item Alzheimer’s Disease Assessment Scale – Cognitive Subscale; ADAS-Cog 13 = 13-item ADAS-Cog; CDR-SB = Clinical Dementia Rating Scale – Sum of Boxes; GDS = Global Deterioration Scale; MCI-CGIC = Mild Cognitive Impairment–Clinical Global Impression of Change; MMSE = Mini-Mental State Examination; SD = standard deviation. CDR-SB (range: 0–18; higher scores indicate greater severity). ADAS-Cog 11 (range: 0–70; higher scores indicate greater dysfunction). ADAS-Cog 13 (range: 0–85; higher scores indicate greater dysfunction). MMSE (range: 0–30; higher scores indicate better functioning). * The percentage with missing data is based on the baseline overall sample size. † The percentage of responses is based on the sample size of the corresponding nonmissing endpoint at the time point of interest.
There was no evidence of floor or ceiling effects, with the exception of the MMSE. At baseline, MMSE total scores were concentrated near the highest (best) end of the 0-to-30 range, and 12.2% of participants achieved the maximum score (indicative of a ceiling effect) at baseline. Although mean MMSE total scores showed slight deterioration from baseline (mean [SD]: 27.27 [1.85]) to Month 36 (25.28 [4.79]), the ceiling (best score) percentage increased to 15.2% overall by Month 36 for participants remaining in the study.
To obtain the test-retest reliability estimate, intraclass correlation coefficients (ICCs) were computed using scores from baseline and Month 6 in the subset of participants with a Month 6 MCI-CGIC rating of “no change.” Results were supportive of adequate test-retest reliability for the CDR-SB, ADAS-Cog 11, and ADAS-Cog 13, with ICC values (CDR-SB, 0.68; ADAS-Cog 11, 0.66; ADAS-Cog 13, 0.76) close to or above the commonly applied threshold of 0.70 (29). ICC values for the MMSE were low (0.48), likely due to the ceiling effect of scores and explained by the fact that participants were required to have an MMSE score ≥ 24 at baseline.
Descriptive statistics for anchor measures
At baseline, most participants were rated as Stage 2 (37.5%) or Stage 3 (57.1%) on the GDS, indicating very mild cognitive impairment or MCI, respectively (Table 2; Figure S-4 and Table S-3 in Supplemental Appendix D present additional details). During follow-up, a small percentage of these participants improved to Stage 1 (e.g., 1.9% had no cognitive decline at Month 36, compared with 0.4% at baseline in 478 participants with scores at both time points), while a larger percentage of participants progressed to Stages 4–6 (e.g., 35.5% moderate-to-severe cognitive decline at Month 36, compared with 5.6% at baseline in participants with scores at both time points).
The MCI-CGIC was assessed at Months 6 and 12 only (Table 2). By Month 12, most participants were reported as experiencing no change (49.6%) or minimal worsening (32.4%) when compared with the beginning of the study; 7.3% had moderate worsening (Appendix D Figure S-4).
Thresholds for meaningful change
The changes in both anchor measures had a correlation strength above 0.30 with CDR-SB changes at Months 6, 12, and 36, confirming adequacy for anchor-based analyses (see Table S-4 in Supplemental Appendix E). For the ADAS-Cog, the strength of the correlations did not meet the 0.3 criterion until Month 12. For the MMSE, the correlation did not meet this threshold until Month 36. Overall, the correlations with the MCI-CGIC tended to be slightly higher than the correlations with GDS change. The 12-month time point was the primary time point considered for estimating meaningful change thresholds due to stronger anchor-target measure correlations, an appropriate time window for deterioration, adequate sample size for categories of interest, and availability of multiple anchors at this time point.
Interpretation of change
Anchor-based estimates were developed for “minimal” and “moderate” meaningful deterioration in the measures of interest (Table 3). Overall, anchor-based analyses using the MCI-CGIC tended to yield lower threshold estimates than analyses using the change in the GDS. Based on median and mean changes, thresholds for the CDR-SB at Month 12 ranged from 0.50–0.64 points for the group with “minimal worsening” (n = 192) and 2.00–2.35 points for the group with “moderate worsening” (n = 43) on the MCI-CGIC, and from 1.00–1.08 points for those with a 1-point (minimal) worsening (n = 132) and 2.75–3.39 points for a those with a 2-point (moderate) worsening on the GDS (n = 14). For the ADAS-Cog, the “minimal-worsening” thresholds based on Month 12 data for the MCI-CGIC anchor suggested 2 points for the ADAS-Cog 11 (n = 190) and 2 points for the ADAS-Cog 13 (n = 190) (rounded to nearest available scores, in consideration of distribution-based results). The “moderate-worsening” thresholds were 3–4 points and 4–5 points for the ADAS-Cog 11 (n = 42) and ADAS-Cog 13 (n = 42), respectively. For the MMSE, progressor thresholds were determined using score changes for participants who had minimal and moderate deterioration on the GDS at Month 36, with 2–3 points for minimal deterioration (n = 108) and 6–7 points proposed for moderate meaningful deterioration (n = 70).
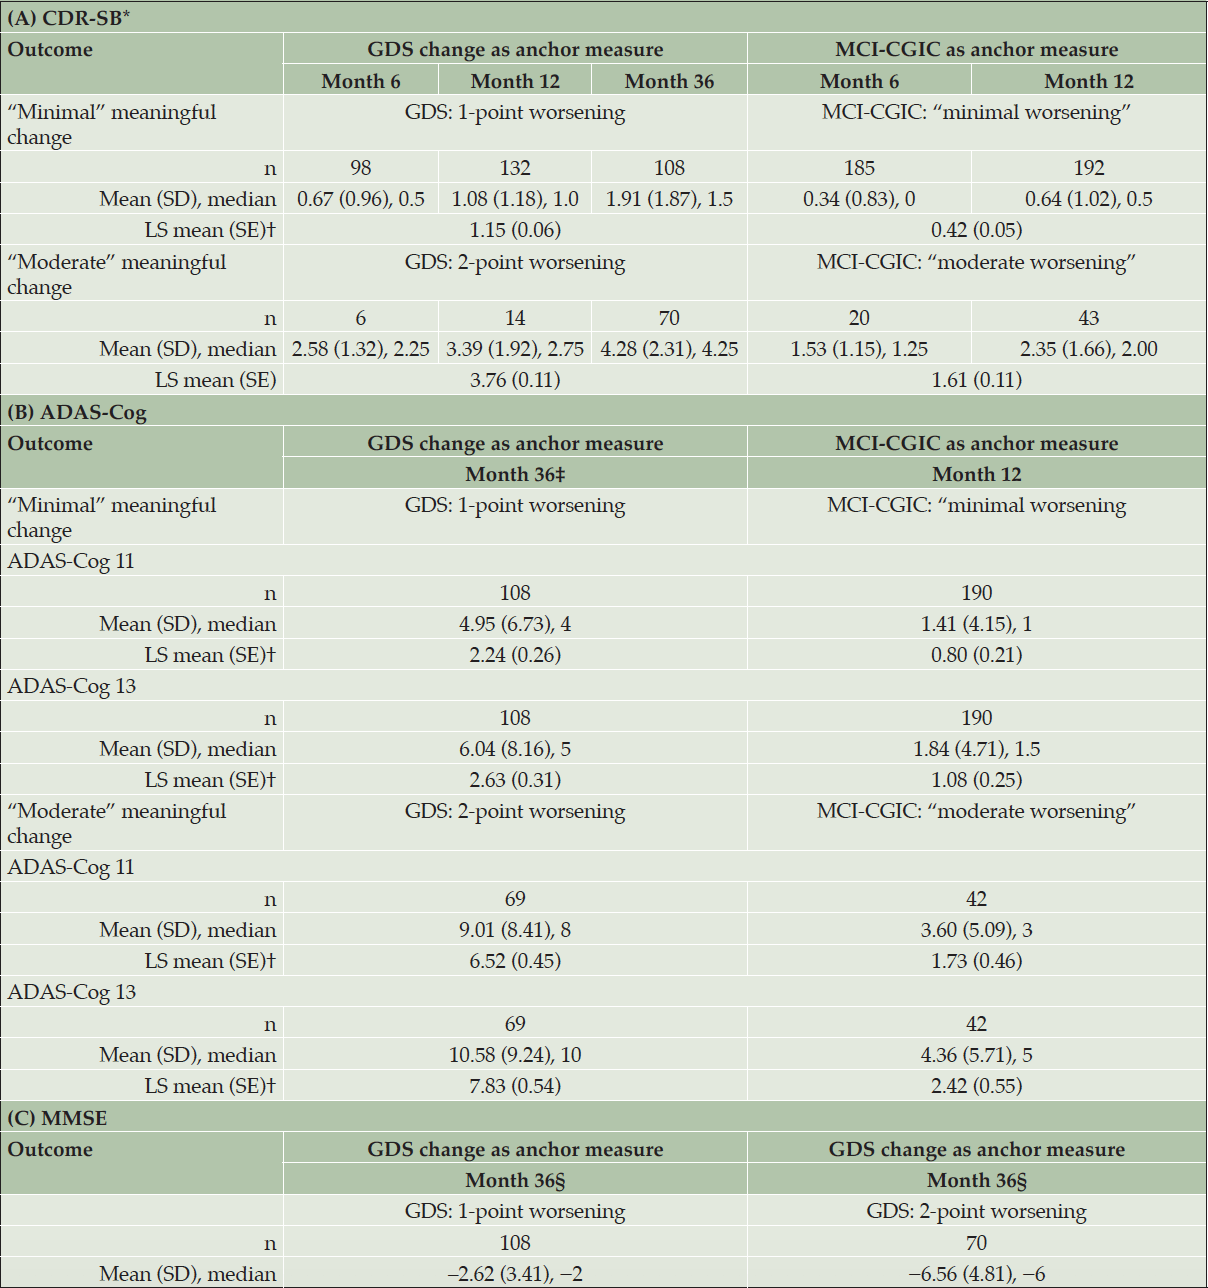
Table 3. Interpretation of change results, for time points with correlations at least 0.3
ADAS-Cog 11 = 11-item Alzheimer’s Disease Assessment Scale – Cognitive Subscale; ADAS-Cog 13 = 13-item ADAS-Cog; CDR-SB = Clinical Dementia Rating Scale – Sum of Boxes; GDS = Global Deterioration Scale; LS = least squares; MCI-CGIC = Mild Cognitive Impairment–Clinical Global Impression of Change; MMSE = Mini-Mental State Examination; SD = standard deviation; SE = standard error. CDR-SB (range: 0–18; higher scores indicate greater severity). ADAS-Cog 11 (range: 0–70; higher scores indicate greater dysfunction). ADAS-Cog 13 (range: 0–85; higher scores indicate greater dysfunction). MMSE (range: 0–30; higher scores indicate better functioning). Note: Sample sizes are shown for the number of patients in the selected anchor category. * For the CDR global, descriptive results for Month 6 are not included due to low correlation strength (|r| < 0.30) between the change in this endpoint and the changes in both anchor measures from baseline to Month 6. † The least squares results of target clinical outcome assessment changes across time were from the mixed models for repeated measures available at Months 6, 12, and 36, using the anchor change as the categorical predictor. ‡ For the ADAS-Cog 11 and ADAS-Cog 13, only descriptive results for Month 36 are provided for the GDS anchor due to low correlation strength (|r| < 0.30) between the change in the endpoints and the change in GDS from baseline to Month 6 and from baseline to Month 12. § For the MMSE, Month 36 was the only time point where the correlation strength between the change in the MMSE and the change in an anchor measure met the 0.3 criterion.
Figure 1 presents the CDF curve for changes in CDR-SB from baseline to Month 12 by MCI-CGIC levels. The curves support the appropriateness of the MCI-CGIC as an anchor measure for the CDR-SB by the clear separation between the moderate worsening (red), minimal worsening (yellow), and no change (tan) curves; approximately 40% of the participants in the moderate-worsening group had more than a 2.5-point increment compared with less than 12.5% of participants in each of the less or no worsening groups. The CDF plots shown in Figures S-1A–S-1F in Supplemental Appendix C provide visual representation of the threshold estimates for the other target measures. In addition, the PDF plots in Figures S-2 and S-3 further support the appropriateness of the anchor measures (see Supplemental Appendix C). Supportive distribution-based estimates, presented in Supplemental Appendix B, were consistently lower (as expected) than the proposed anchor-based means and medians for moderate deterioration, with the exception of the very large reliable change index values for the ADAS-Cog 11 (7.12) and the ADAS-Cog 13 (8.25).
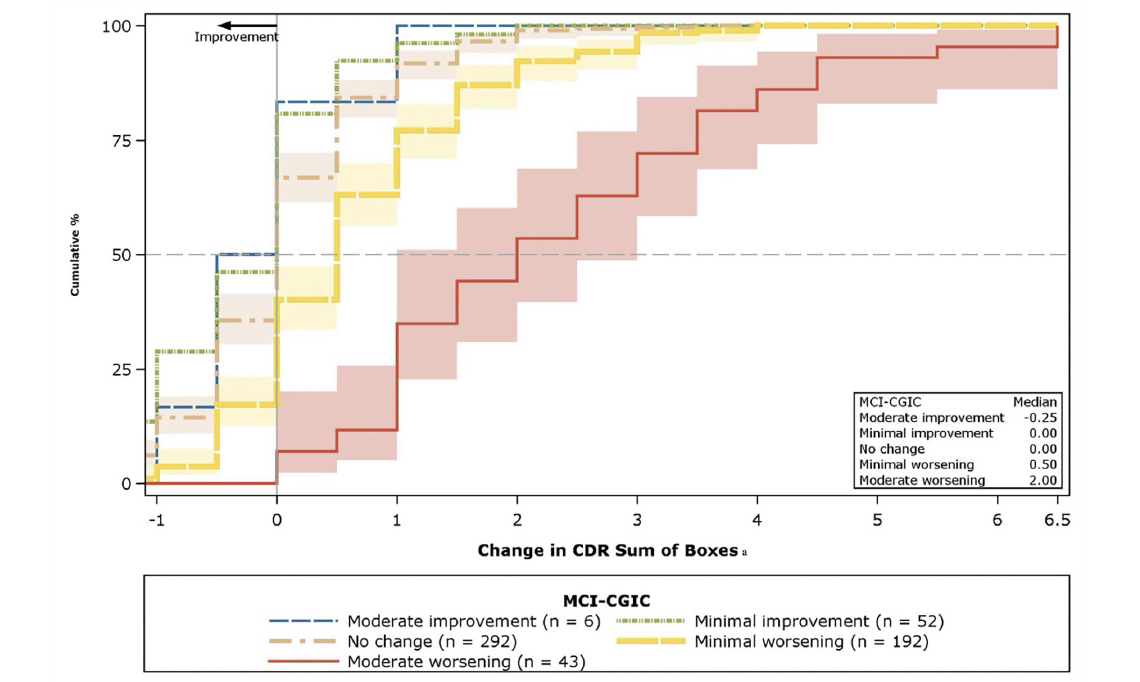
Figure 1. Cumulative distribution function plots: Change in CDR-SB from baseline to Month 12, by MCI-CGIC
The median value is plotted as a dotted line, and the shading around the CDF curves (solid lines) shows the 95% CIs of the change score distributions. CI = confidence interval; CDR-SB = Clinical Dementia Rating Scale- Sum of Boxes; CDF = cumulative distribution function; MCI = Mild Cognitive Impairment–Clinical Global Impression of Change. Note: Bands around lines denote 95% confidence limits with colors specified by the legend for n > 5. a The plotting range of the x-axis is from the Month 12 minimum change of the “moderate improvement” group to the Month 12 maximum change of “moderate worsening” group.
Application of the within-patient meaningful-change threshold values
Table 4 summarizes the number and percentage of progressors at Month 12 based on the proposed thresholds for the overall study population; Table S-5 in Supplemental Appendix F presents these results by treatment arm.
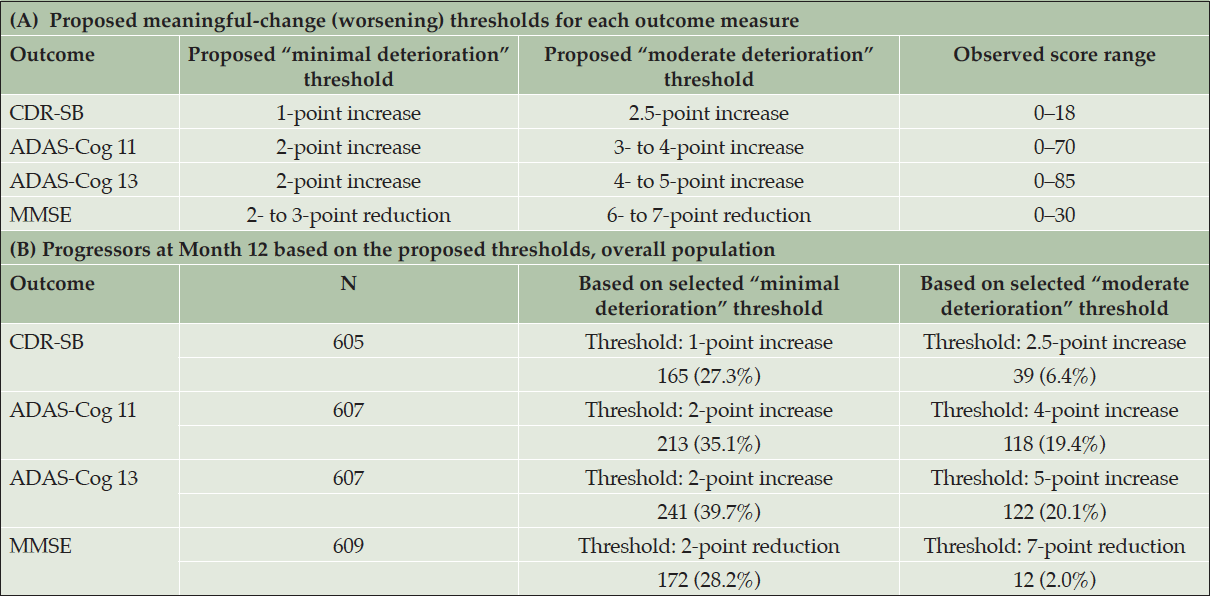
Table 4. Proposed meaningful-change (worsening) thresholds
ADAS-Cog 11 = 11-item Alzheimer’s Disease Assessment Scale – Cognitive Subscale; ADAS-Cog 13 = 13-item ADAS-Cog; CDR-SB = Clinical Dementia Rating Scale – Sum of Boxes; MMSE = Mini-Mental State Examination. CDR-SB (range: 0–18; higher scores indicate greater severity). ADAS-Cog 11 (range: 0–70; higher scores indicate greater dysfunction). ADAS-Cog 13 (range: 0–85; higher scores indicate greater dysfunction). MMSE (range: 0–30; higher scores indicate better functioning).
Discussion
This analysis explored meaningful within-patient change thresholds for the CDR-SB, ADAS-Cog, and MMSE using anchor-based methods, evaluating both change and severity at multiple time points, and supportive distribution-based analyses. Focusing on the 12-month time point, and considering the change associated with minimal and moderate levels of deterioration on the available anchors, on average, increases of 1 to 2.5 points on the CDR-SB and increases of 2 to 5 points on the ADAS-Cog 11 and ADAS-Cog 13 may be appropriate thresholds for individual-level meaningful change. This triangulation of methods lends credibility to the generated estimates. The results may support the interpretation of longitudinal data captured using these measures; for example, these values may be considered when defining a threshold to identify progressors, or PLWA who have deteriorated meaningfully within the context of future AD clinical trials targeting people with MCI due to AD.
The correlation between the anchors and the MMSE was generally weak and only sufficient at the 36-month time point for anchor-based analyses. Such a lengthy period is likely to inflate the estimate and as such these results should be interpreted with caution. At Month 36, decreases of 2 to 7 points on the MMSE reflected minimal to moderate levels of deterioration at the individual level, respectively.
This analysis complements a previous study by Andrews et al. (12), which suggested thresholds of 1-to-2 point increases in the CDR-SB and 1-to-3 point decreases on the MMSE for prodromal and mild disease, respectively, based on evaluations over 1 year on average to define within-patient minimal clinically meaningful decline. Compared to the Andrews et al. (12) study, the range of estimates for the MCI stage that we identified using the ADCS study are somewhat higher. This could be explained by differences in the anchors applied, a longer and/or less variable follow-up period for ADCS compared to NACC, or differences in the severity of patients due to study inclusion criteria. Their main analysis used a binary (yes vs no) clinician assessment of meaningful decline in patient memory, nonmemory cognitive ability, behavior, ability to manage affairs, or motor/movement changes since the previous visit. This current study provides additional granularity by providing both a retrospective change and prospective severity anchor and a range of meaningful-change thresholds for mild and moderate levels of deterioration, enabling more specific and conservative threshold estimates.
There are important considerations when implementing or applying meaningful-change thresholds to clinical trial populations, including the target population, trial duration, and anticipated treatment effect. In studies with shorter follow-up, it may be feasible to implement only the minimal thresholds, as more pronounced declines on COAs will be rare. In studies with longer follow-up or those that enrich for rapidly progressing patients, it may be appropriate to implement moderate-progression thresholds. Andrews et al. (2019) further highlighted the need for different thresholds depending on the disease stage of the target population (12). The FDA has also encouraged sponsors to consider using a range of change thresholds to convey the hypothesized treatment effect (7).
After a threshold (or range of thresholds) is established, there are a number of potential applications to clinical trial data. For example, it could be used to compare the percentage of PLWA who deteriorate meaningfully across treatment arms at the end of the study period (a within-patient analysis). Such analyses may aid in interpreting data from AD clinical trials at an individual level, with the aim of evaluating treatment effects that are meaningful and tangible to PLWA. Thresholds could also facilitate time-to-deterioration analyses. Importantly, the thresholds should not be used to evaluate whether the magnitude of difference between drug and placebo groups in terms of their change from baseline is meaningful (a between-group analysis). A challenge in detecting small yet clinically meaningful treatment effects in AD trials is that, on average, PLWA progress slowly with modest deterioration over a typical trial duration. Consideration should be given to trial-design strategies that maximize the likelihood of detectable progression over the course of the study, such as biomarker-confirmed enrichment strategies and sufficient trial duration.
Some limitations of this analysis and the methods are acknowledged. First, biomarker confirmation of AD was not an inclusion criterion of ADC-008, and as such, some participants may not have had underlying AD pathology. Indeed, 4% of participants had CDR Global Scores of 0 at Month 36, indicating normal cognitive and functional abilities, suggesting either a lack of deterioration (very slow progressors) or in some cases an improvement over time. Second, we could not evaluate the potential for interrater variability as a source of error for anchor and target measures because information about raters was generally limited. Third, a methodological challenge with anchor-based analyses is the potential for the meaningful-change threshold estimates to be influenced by the effect of time. While changes in scores on the target measures increased/decreased with time, an individual may have remained in the same anchor category across time points, potentially leading to an overestimation of change when selecting later time points for threshold estimation; conversely, for an individual about to transition from a minimal- to a moderate-worsening anchor category, score increases on the target measures may have led to an underestimation of change if selecting the earlier time point for threshold estimation. Considering this, as well as descriptive statistics and correlation patterns for the measures, the Month 12 time point was selected as the primary time point for the evaluation. This time point balanced adequate correlation between changes, as defined by both anchor measures and most target measures, with a limiting lapse in time between the two assessments. Unfortunately, the MMSE-anchor correlation was inadequate at any time point prior to Week 36, which may account for the higher threshold estimates compared with those currently reported in the existing literature (based on 12-month data). Finally, these thresholds are generated using clinician-rated anchors and may not reflect score change associated with caregiver-reported meaningful change. Anchor-based analyses using caregiver-rated global impression measures, or alternative methods to incorporate the care partner and patient perspective into meaningful change estimates, are warranted.
Future research could evaluate whether the thresholds identified here are relevant for PLWA and care partners via qualitative studies and should explore applicability of these thresholds across AD stages. The latter is particularly important for the CDR-SB, which has a nonlinear response scale such that category changes at the more severe levels of AD result in greater magnitude of score change than those at the earlier stages of disease.
In conclusion, the proposed thresholds may be useful to aid the interpretation of AD clinical trial data at an individual patient level and inform treatment decisions. Estimates generated via these methods are specifically intended to evaluate within-patient change and are not intended to assess the magnitude and meaningfulness of differences between group-level changes over time. The results from this ADC-008 analysis are an important step toward threshold consensus for meaningful within-patient change in key outcomes in AD.
Acknowledgments: Data used in the preparation of this article were obtained from the Alzheimer’s Disease Cooperative Study legacy database, supported in part by The National Institute on Aging.
Data Sharing: For eligible studies qualified researchers may request access to individual patient level clinical data through a data request platform. At the time of writing this request platform is Vivli. https://vivli.org/ourmember/roche/. For up to date details on Roche’s Global Policy on the Sharing of Clinical Information and how to request access to related clinical study documents, see here: https://go.roche.com/data_sharing. Anonymised records for individual patients across more than one data source external to Roche can not, and should not, be linked due to a potential increase in risk of patient re-identification.
Funding: This analysis was conducted under a research contract between RTI Health Solutions and Roche and was funded by F. Hoffmann-La Roche Ltd. Authors affiliated with the sponsor of this analysis, F. Hoffmann-La Roche Ltd, participated in designing the study; in analyzing and interpreting the data; in writing the report; and in the decision to submit the article for publication.
Conflict of interest disclosure: This analysis was conducted under a research contract between RTI Health Solutions and F. Hoffmann-La Roche Ltd and was funded by F. Hoffmann-La Roche Ltd. CJL, FM, PD, NP, GAK, and RD are employees of F. Hoffmann-La Roche Ltd. LMB was an employee of F. Hoffmann-La Roche Ltd. during the authoring of the manuscript. CJL, FM, LMB, NP, and GAK are also shareholders of F. Hoffmann-La Roche Ltd. SQ, LM, and XZ are employees of RTI Health Solutions.
Ethical standard: Data used in this validation study were previously published (14). All human procedures were conducted in accordance with the Declaration of Helsinki and Good Clinical Practice.
Open Access: This article is distributed under the terms of the Creative Commons Attribution 4.0 International License (http://creativecommons.org/licenses/by/4.0/), which permits use, duplication, adaptation, distribution and reproduction in any medium or format, as long as you give appropriate credit to the original author(s) and the source, provide a link to the Creative Commons license and indicate if changes were made.
References
1. Posner H, Curiel R, Edgar C, et al. Outcomes assessment in clinical trials of Alzheimer’s disease and its precursors: readying for short-term and long-term clinical trial needs. Innov Clin Neurosci. 2017;14(1-2):22-29.
2. Food and Drug Administration (FDA). Guidance for industry. Early Alzheimer’s disease: developing drugs for treatment. February 2018a. https://www.fda.gov/media/110903/download
3. Food and Drug Administration (FDA). Guidance for industry. Patient-reported outcome measures: use in medical product development to support labeling claims. December 2009. http://www.fda.gov/downloads/Drugs/GuidanceComplianceRegulatoryInformation/Guidances/UCM193282.pdf
4. Food and Drug Administration (FDA). Patient-focused drug development (PFDD) guidance: methods to identify what is important to patients & select, develop or modify fit-for-purpose clinical outcomes assessments. October 15-16, 2018b. https://www.fda.gov/drugs/newsevents/ucm607276.htm (accessed February 20, 2020).
5. McLeod LD, Fehnel SE, Cappelleri JC. Patient-reported outcome measures: development and psychometric validation. In: Peace KE, Chen D-G, Menon S (editors). Biopharmaceutical Applied Statistics Symposium: Design of Clinical Trials. Singapore: Springer Nature Singapore Pte Ltd; 2018, p. 317-346.
6. Rentz DM, Wessels AM, Annapragada AV, et al. Building clinically relevant outcomes across the Alzheimer’s disease spectrum. https://doi.org/10.1002/trc2.12181.
7. Food and Drug Administration (FDA). Patient-focused drug development public workshop: incorporating clinical outcome assessments into endpoints for regulatory decision-making. December 6, 2019. https://www.fda.gov/media/132505/download
8. Food and Drug Administration (FDA). FDA Patient-Focused Drug Development Guidance Series for Enhancing the Incorporation of the Patient’s Voice in Medical Product Development and Regulatory Decision Making. June 29, 2022. https://www.fda.gov/drugs/development-approval-process-drugs/fda-patient-focused-drug-development-guidance-series-enhancing-incorporation-patients-voice-medical (accessed August 15, 2022)
9. Burback D, Molnar FJ, St John P, Man-Son-Hing M. Key methodological features of randomized controlled trials of Alzheimer’s disease therapy. Minimal clinically important difference, sample size and trial duration. Dement Geriatr Cogn Disord. 1999;10:534-540; https://doi.org/10.1159/000017201.
10. Howard R, Phillips P, Johnson T, et al. Determining the minimum clinically important differences for outcomes in the DOMINO trial. Int J Geriatr Psychiatry. 2011;26:812-817; https://doi.org/10.1002/gps.2607.
11. Molnar FJ, Man-Son-Hing M, Fergusson D. Systematic review of measures of clinical significance employed in randomized clinical trials for drugs for dementia. J Am Geriatr Soc. 2009;57:536-546; https://doi.org/10.1111/j.1532-5415.2008.02122.x.
12. Andrews JS, Desai U, Kirson NY, Zichlin ML, Ball DE, Matthews BR. Disease severity and minimal clinically important differences in clinical outcome assessments for Alzheimer’s disease clinical trials. Alzheimers Dement (N Y). 2019;5:354-363; https://doi.org/10.1016/j.trci.2019.06.005.
13. Atri A. The Alzheimer’s disease clinical spectrum: diagnosis and management. Medical Clinics. 2019;103(2):263-293; https://doi.org/10.1016/j.mcna.2018.10.009.
14. Petersen RC, Thomas RG, Grundman M, et al. Vitamin E and donepezil for the treatment of mild cognitive impairment. N Engl J Med. 2005;352(23):2379-2388; https://doi.org/10.1056/NEJMoa050151.
15. Hughes CP, Berg L, Danziger WL, Coben LA, Martin, RL. A new clinical scale for the staging of dementia. Br J Psychiatry. 1982;140:566-572; https://doi.org/10.1192/bjp.140.6.566.
16. Williams MM, Storandt M, Roe CM, Morris JC. Progression of Alzheimer’s disease as measured by Clinical Dementia Rating Sum of Boxes scores. Alzheimers Dement. 2013;9(1 Suppl):S39-44; https://doi.org/10.1016/j.jalz.2012.01.005.
17. Rosen WG, Mohs RC, Davis KL. A new rating scale for Alzheimer’s disease. Am J Psychiatry. 1984;141(11):1356-1364; https://doi.org/10.1176/ajp.141.11.1356.
18. Wesnes KA. Assessing change in cognitive function in dementia: the relative utilities of the Alzheimer’s Disease Assessment Scale-Cognitive Subscale and the Cognitive Drug Research system. Neurodegener Dis. 2008;5(3-4):261-263; https://doi.org/10.1159/000113719.
19. Rockwood K, Fay S, Gorman M, Carver D, Graham JE. The clinical meaningfulness of ADAS-Cog changes in Alzheimer’s disease patients treated with donepezil in an open-label trial. BMC Neurol. 2007;7:26. https://doi.org/10.1186/1471-2377-7-26.
20. Mohs RC, Knopman D, Petersen RC, et al. Development of cognitive instruments for use in clinical trials of antidementia drugs: additions to the Alzheimer’s Disease Assessment Scale that broaden its scope. The Alzheimer’s Disease Cooperative Study. Alzheimer Dis Assoc Disord. 1997;11(Suppl 2):S13-21.
21. Verma N, Beretvas SN, Pascual B, Masdeu JC, Markey MK. New scoring methodology improves the sensitivity of the Alzheimer’s Disease Assessment Scale-Cognitive subscale (ADAS-Cog) in clinical trials. Alzheimers Res Ther. 2015;7:1-17; https://doi.org/10.1186/s13195-015-0151-0.
22. Kueper JK, Speechley M, Montero-Odasso M. The Alzheimer’s disease assessment scale–cognitive subscale (ADAS-Cog): modifications and responsiveness in pre-dementia populations. a narrative review. J Alzheimers Dis. 2018;63(2):423-444; https://doi.org/10.3233/JAD-170991.
23. Folstein M, Folstein SE, McHugh PR. “Mini-Mental State” a practical method for grading the cognitive state of patients for the clinician. J Psychiatr Res. 1975;12(3):189-198; https://doi.org/10.1016/0022-3956(75)90026-6.
24. Reisberg B, Ferris SH, Franssen EH, et al. Mortality and temporal course of probable Alzheimer’s disease: a 5-year prospective study. Int Psychogeriatr. 1996;8(2):291-311; https://doi.org/10.1017/s1041610296002657.
25. Alzheimer Disease Research Center at the University of Southern California. CGIC or ADCS-CGIC: one of the most common global change form used in Alzheimer’s disease trials. 2018. http://adrc.usc.edu/cgic/ (accessed December 31, 2018).
26. Schneider LS, Raman R, Schmitt FA, et al. Characteristics and performance of a modified version of the ADCS-CGIC CIBIC+ for mild cognitive impairment clinical trials. Alzheimer Dis Assoc Disord. 2009;23(3):260-267; https://doi.org/10.1097/WAD.0b013e31819cb760.
27. Revicki D, Hays RD, Cella D, Sloan J. Recommended methods for determining responsiveness and minimally important differences for patient-reported outcomes. J Clin Epidemiol. 2008;61(2):102-109; https://doi.org/10.1016/j.jclinepi.2007.03.012.
28. Hays RD, Brodsky M, Johnston MF, Spritzer KL, Hui K. Evaluating the statistical significance of health-related quality of life change in individual patients. Eval Health Prof. 2005;28:160-171; https://doi.org/10.1177/0163278705275339.
29. Cohen J. A power primer. Psych Bulletin. 1992;112(1):155-159; https://doi.org/10.1037/0033-2909.112.1.155.
30. Nunnally JC, Bernstein IH. Psychometric Theory. 3rd ed. New York: McGraw-Hill; 1994.
© The Authors 2022