
N. Tavabi1,*, D. Stück2,*, A. Signorini2, C. Karjadi3,4, T. Al Hanai5, M. Sandoval2, C. Lemke2, J. Glass5, S. Hardy3,4, M. Lavallee4, B. Wasserman4, T.F.A. Ang3,4,6, C.M. Nowak4, R. Kainkaryam2, L. Foschini2,**, R. Au3,4,6,7,**
1. University of Southern California, Los Angeles, CA, USA; 2. Evidation Health, Inc., Menlo Park, CA, USA; 3. Framingham Heart Study, Framingham, MA, USA; 4. Boston University School of Medicine, USA; 5. Massachusetts Institute of Technology, Cambridge, MA, USA; 6. Boston University School of Public Health, USA;
7. Alzheimer’s Disease Center, Boston, MA, USA; †,‡ Authors contributed equally; 4 Institutional attribution is at time of contribution; * These authors contributed equally; ** These authors contributed equally.
Corresponding Author: Rhoda Au, 72 E. Concord Street, Boston University School of Medicine, Boston, MA 02118. Telephone: (617) 358-0089; email: rhodaau@bu.edu
J Prev Alz Dis 2022;4(9):791-800
Published online July 13, 2022, http://dx.doi.org/10.14283/jpad.2022.66
Abstract
BACKGROUND: Although patients with Alzheimer’s disease and other cognitive-related neurodegenerative disorders may benefit from early detection, development of a reliable diagnostic test has remained elusive. The penetration of digital voice-recording technologies and multiple cognitive processes deployed when constructing spoken responses might offer an opportunity to predict cognitive status.
Objective: To determine whether cognitive status might be predicted from voice recordings of neuropsychological testing
Design: Comparison of acoustic and (para)linguistic variables from low-quality automated transcriptions of neuropsychological testing (n = 200) versus variables from high-quality manual transcriptions (n = 127). We trained a logistic regression classifier to predict cognitive status, which was tested against actual diagnoses.
Setting: Observational cohort study.
Participants: 146 participants in the Framingham Heart Study.
Measurements: Acoustic and either paralinguistic variables (e.g., speaking time) from automated transcriptions or linguistic variables (e.g., phrase complexity) from manual transcriptions.
Results: Models based on demographic features alone were not robust (area under the receiver-operator characteristic curve [AUROC] 0.60). Addition of clinical and standard acoustic features boosted the AUROC to 0.81. Additional inclusion of transcription-related features yielded an AUROC of 0.90.
Conclusions: The use of voice-based digital biomarkers derived from automated processing methods, combined with standard patient screening, might constitute a scalable way to enable early detection of dementia.
Key words: Dementia, AD screening, biomarkers, predictive modeling.
Introduction
The incidence of dementia generally and Alzheimer’s disease specifically is increasing (1), largely because of the increased life expectancy of the global population, making this a major source of healthcare expenditure. Despite the increasing prevalence of dementia across the world, the disease is often diagnosed late in its progression. This is partly due to the heterogeneity of the disease both in symptom onset and progression.
No single cognitive test exists that can accurately diagnose dementia, the subtype of Alzheimer’s disease, or the preclinical stage of mild cognitive impairment (MCI) across a culturally diverse population. Instead, diagnoses are reached through a combination of clinician-administered tests, including assessments of medical and family history, cognitive function, other functional behaviors, peripheral biomarkers (e.g., nutritional deficiency), and, increasingly, brain imaging. Reliance on these diagnostic tools has led to significant health disparities in diagnosing, treating, and studying dementia and Alzheimer’s disease across the U.S. and around the world.
Even within high-resourced environments, by the time traditional Alzheimer’s symptoms of declining memory are noteworthy, the neurodegenerative trajectory is believed to be on a near-irreversible course. While there is no definitely curative drug treatment for the disease at present, delaying onset by just 5 years could potentially cut societal prevalence in the U.S. by 50% (2, 3). Early detection, and thus early intervention, could improve quality of life, helping alleviate symptoms and slow the progression of disease (4, 5).
Dementia is an insidious disease that takes up to decades to develop, and its nature provides the opportunity for prediction through subtle clinical changes that may appear years before a person meets the criteria for diagnosis. Increasingly, the use of digital biomarkers is being explored for screening and diagnosis, while ‘digital therapeutics’ are also emerging (5, 6). Digital biomarkers are physiological and behavioral measures collected from participants through digital tools that can be used to explain, influence, or predict health-related outcomes (7). The deep penetration of smartphones with voice recorders, coupled with the fact that production of speech involves multiple cognitive domains, suggests that voice-based digital biomarkers could open possibilities for a scalable, economical (automated transcription costs ~$1 per 15-minute sample) (8), and widely accessible (due to real-time administration and scoring of neuropsychological tests) test to detect changes in individuals who have not yet met the threshold for clinical symptoms (9).
The goal of this study was to examine whether metrics extracted from digital audio recordings could serve as potential digital voice biomarkers, through the development of a predictive algorithm for earlier detection of cognitive dysfunction, and thereby improve outcomes.
Methods
Ethics
The study protocol was approved by the Institutional Review Board of Boston University, Boston, Massachusetts. All participants provided informed consent at the time of enrollment into the study.
Study participants
The first-generation (Gen 1) cohort of the Framingham Heart Study (FHS) was enrolled in 1948 with 5,209 adult subjects from Framingham, Massachusetts, USA; the second-generation cohort (Gen 2, the biological children of the Gen 1 cohort and their spouses), in 1971; and the third-generation cohort (Gen 3), in 2001 (10). To reflect the growing racial/ethnic diversity of the region, the multi-ethnic Omni Generation 1 (OmniGen 1) and Omni Generation 2 (OmniGen 2) were enrolled beginning in 1994 and 2003, respectively.
Since 1975, participants in the FHS have been under surveillance for incident dementia (11). This has entailed having adults and older adolescents undergo periodic neuropsychological exams consisting of a set of standard tests to evaluate cognitive function (see details below). The audio for most of these sessions (see details below) has been recorded since 2005, creating a database of over 5200 sessions in August 2017. We analyzed a subset of digital voice recordings from 146 participants, all of whom had consensus-confirmed normal cognition, MCI, or dementia diagnoses.
Demographic and clinical variables
Standard demographic data were collected at each neuropsychological exam for all participants, including age, sex, marital status, occupation type, and highest level of education obtained. Clinical data—which were collected through separate, regular general health exams—included laboratory data (serum glucose, low- and high-density lipoprotein cholesterol, triglyceride, and creatinine levels), body anthropomorphics (height, weight, body mass index, and hip and waist girth), physiological data (heart rate and blood pressure), and health behavior data (self-reported mood, physical activity, alcohol consumption, diet, sleep, and smoking). For analysis purposes, we extracted these clinical data from the general exam that had been performed closest to the time of consensus dementia determination (see below). We standardized quantitative clinical variables by taking the difference between the most recent measure and the historical maximum and minimum values.
Neuropsychological exams and consensus determination of dementia labels
These exams consisted of both closed and open-ended questions as well as recall tasks. Testing included the Wechsler Memory Scale Logical Memory, Verbal Paired Associates, and the Wechsler Adult Intelligence Scale Digit Span tests (forward and backward).
The Logical Memory test is a narrative recall task in which the proctor reads a story aloud and then asks the subject to recall the components of the story back to the examiner. The Verbal Paired Associates task requires the proctor to read the participant a list of words consisting of 10 word pairs: 6 “easy”, related pairs (e.g., words that are frequently associated, such as “stop-go”) and 4 “hard”, unrelated pairs (e.g., words that are not typically associated, such as “bronze-hop”). The proctor then says one of the words and asks the participant to say which word went with it. This is administered three times, each time with feedback: either “that’s right” or “no, that one was [correct answer]”. During each of the three trials, the participant is consistently presented only with the first word of each pair and asked to provide the corresponding word.
For the Digit Span Forward test, the proctor reads the participant a span of numbers, starting with three numbers in a monotone voice, and the participant must repeat the numbers. If the sequence is correct, they move onto a span of numbers one longer, and if it is incorrect, they are given a second chance for each span length. For the Digit Span Backward test, the proctor reads a sequence of numbers that the participant must repeat in reverse order.
Dementia determinations took place at various times after neuropsychological testing/voice recordings. For these reviews, the consensus diagnostic panel used a scale analogous to the Clinical Dementia Rating scale to classify dementia severity on a scale of “none” (0) to “severe” (3), modified with additional intermediates between each whole integer point. Participants were flagged for dementia review if they had a drop in Mini-Mental State Examination (MMSE) score, if they presented potential cognitive impairment at a neuropsychological exam, and/or were referred by FHS staff or a family member. Test results were reviewed by a consensus panel that included at least one neurologist and neuropsychologist. The review panel determined cognitive status markers on a case-by-case basis using supporting sources of medical information (e.g., neuropsychology and neurology exams, family interviews, FHS health exams, and external medical records). Details of the consensus process have been published previously (11-13). This consensus diagnosis of dementia and any subtype diagnosis (e.g., Alzheimer’s disease) served as the gold standard against which the predictive models were developed. The consensus diagnosis for each sample was used only to train (as target labels) and quantify the performance of the predictive models and were not used as inputs to them. For the purposes of this project, all participants whose recordings were used for the cognitively normal (CN) analyses were verified to be CN at the time of the recording.
Audio recordings of neuropsychology exams
Digital voice recordings consisted of a structured conversation between a proctor, who was a trained clinical staff member of the FHS, and the FHS participant, who may or may not have been cognitively impaired. Through a semi-supervised approach that complemented automated speech-to-text with manual tagging of a few relevant parts of the neuropsychological test, all personally identifiable information was removed from recordings before linking to other deidentified FHS health data.
Overview of acoustic analysis
Acoustic analysis, speech transcription, and language processing were used to automatically reduce voice segments from recordings into a set of candidate digital biomarkers. Specifically, we extracted acoustic variables (capturing the temporal and spectral characteristics of a person’s voice) from all recordings of neuropsychological testing.
Language-based variables were computed from the annotated text obtained through both automated (IBM Watson) and manual transcriptions. For hand-transcribed recordings, linguistic variables were extracted that captured characteristics of the grammar and complexity of the responses. In the automatically transcribed recordings, the quality of the transcription was not sufficient to allow linguistic analysis. We could compute variables relating to the timing and frequency of words, however, which we termed “paralinguistic” variables.
Automated transcription generation
IBM Watson’s application program interface (API) transcribed the recordings, and provided the best guess for the word, a measure of uncertainty that the word was correct, and start/end timestamps at a precision of 0.01 s. The API then prioritized for manual diarization based on age, dementia status, and specific neuropsychological test completion. This approach provided 1) high-accuracy word and pause lengths, 2) the ability to precisely identify snippets of anonymized audio when combined with manual diarization, and 3) a measure of text translatability in the form of word uncertainties.
For 248 recordings (of which 200 consented by participants to be analyzed by a commercial company), diarization was manually completed to distinguish between speakers for the Logical Memory, Verbal Paired Associates, and Digit Span tests. Codes used to refer to each subsection of interest are shown in Supplementary Table 1.
Manual transcription generation
For 140 recordings (of which 127 consented by participants to be analyzed by a commercial company), a professional transcription company created timestamped, diarized transcriptions to gauge the efficacy of the automated transcription and diarization method. These transcriptions provided high-accuracy, grammatically meaningful representations of the audio files. The professional transcriptions were double-checked by the research team at Boston University to confirm relative accuracy.
Acoustic variable extraction
To generate acoustic variables, the audio corresponding to participant speech was extracted, which included both diarized automated-transcription files and manual diarizations. Variables from the raw waveform were then extracted using the Massachusetts Institute of Technology’s featurization algorithm and the openSMILE toolkit (14) with a frame size of 20 ms and a step size of 10 ms. Spectral and temporal characteristics of a subject’s voice, including mel-frequency cepstral coefficients (MFCCs), pitch, and root-mean-square energy (RMS), were computed across these windows based on the variable list associated with the 2013 Interspeech Paralinguistics Challenge (15). Voicing probability was used to remove extended periods of silence from the samples, and the energy-based variables were normalized. Aggregation was done over the frames, computing mean, median, standard deviation, minimum, and maximum values to generate the final acoustic variable set. The following variables were computed and used: MFCCs, fundamental frequency (F0), voicing probability, local jitter, difference of differences jitter, local shimmer, harmonics to noise ratio (HNR), power spectrum (audspec), relative spectral transform (RASTA), zero crossing rate, and RMS.
Paralinguistic variable extraction (automated transcriptions)
After processing, we computed the paralinguistic variables from automated transcription (Watson) on each of the sections identified as well as the full text. Detailed descriptions of these variables and codes are provided in Supplementary Table 2. Although computing variables on the full text added additional noise to the signal due to inclusion of the proctor’s speech, this was standard across all exams due to their scripted nature. To featurize these data, we considered word use, speech time, word certainty, and Bristol-norm variables (16). Word use variables included the number of words, the fraction of stop words used, and the fraction and count of common words. Common words were defined as the top 10 most frequently used words for each section, and they can be viewed as a problem-specific assessment of how similar the participant’s answer was to that of others. Speech time variables included the total speaking time, mean and standard deviation of word and pause lengths (in seconds), fraction of time spent pausing, total section time, and fraction of that section the participant was speaking. The average and standard deviation of word uncertainty provided by the Watson algorithm were also included. Bristol norm variables quantified the age of word acquisition, imageability, familiarity, neighborhood size, mean log bigram frequency, and number of letters, syllables, and phonemes for a subset of words. The full set of words in the diarized sections was sorted for variant forms of the same word using the Princeton Wordnet lemmatizer (wordnet.princeton.edu). We computed the mean and standard deviation of these properties as well as the fraction of words used that have computable Bristol norms.
Linguistic variables extraction (manual transcriptions)
Manually transcribed files contained fully diarized, accurate, and grammatically meaningful text. The fidelity of these transcriptions allowed applying natural language processing (NLP) techniques to extract information from the grammar of the sentences to evaluate the complexity of the responses. Additional variables included embeddings (numerical representations of text) from pretrained language models such as doc2vec (17). Specifically, one model was trained to learn representation from the participant’s responses, and another to learn representation for the whole conversation. These two embeddings were then concatenated to use as variables for the text classification task. Each model was trained using the distributed bag-of-words training algorithm, with 100-dimension embedding and a window size of 5, negative sampling of 10, and minimum count threshold of 5. Linguistic variables were therefore generated based on the whole interview, as opposed to the paralinguistic variables, which were generated based on different sections of the interview as well as the whole session.
To analyze the use of production rules, we used the Charniak-Johnson parser trained on the Wall Street Journal (18, 19). We also computed the frequency of the top 50 most common production rules over all transcriptions (20). The mean, standard deviation, and 5th, 50th, and 95th percentiles of the tree height; number of phrases; and parser score of the selected tree over all sentences were also computed. The top 10 production rules found with their relative frequencies are listed in Supplementary Table 3. Bristol norm variables were computed as for the automated transcriptions with the addition of a part-of-speech tagger implemented in the natural language toolkit (NLTK) Python module (21) to improve lemmatization. We also computed qualitative measures such as the fraction of nonverbal breaks (e.g., filler words, laughing, crosstalk) over the total number of words spoken by each participant. Finally, additional measures of syntactic complexity using the L2 syntactic complexity analyzer were computed (22). This analysis returns the frequency of words, sentences, verb phrases, clauses, T-units, dependent clauses, complex T-units, coordinate phrases, and complex nominals, and takes 14 ratios of these frequencies that represent various measures of sentence complexity. These variables were all generated based on the whole transcript, as opposed to different sections of it.
Predictive model development
Participant cognitive status—no impairment, MCI, or dementia—was modelled from available demographic, clinical, acoustic, and linguistic and/or paralinguistic variables. Specifically, two machine-learning classifiers were trained to predict cognitive status: one using demographic, clinical, acoustic, and linguistic variables for participants with hand-transcribed recordings and one using demographic, clinical, acoustic, and paralinguistic variables for those with automated transcriptions. Figure 1 shows the categories of variables available for each subset of recordings.
For both of these machine-learning classifiers, the audio data originated from the voice recordings of neuropsychological testing. In contrast, the clinical data were the most recent available at the time of dementia determination, which came after a significant time delay from the neuropsychological testing in some cases. This difference in time of information acquisition reflects typical real-world practice, i.e., using the results of prior neuropsychological tests combined with the most recent clinical information when determining a patient’s dementia status.
We first applied the Disparate Impact Remover (DIR) (23) to account for age and sex biases in the data. This was an unsupervised preprocessing step that transformed the variables such that they could not be used to distinguish age/sex while also preserving relevant information. DIR has a hyper-parameter (repair value), between 0 and 1, that sets the deconfounding level of the transformation. Because there was near-zero bias in the dataset, we set the repair value to 1 for all analyses except for the common subset. For the latter analysis, a repair value of 0.7 was used.
We then used the minimum redundancy/maximum relevance (MRMR) method (24), which selects the top-ranking variables by maximizing their relevance towards the label (F-test) and minimizing their redundancy (correlation). To use MRMR in cross-validation, the top-N variables are chosen in each fold of nested training before hyperparameter tuning. Variables consistent across folds (selected as top-N in different folds) are identified, and the model hyperparameters are tuned only on them. N was chosen to be one of {10, 20, .., 50} as part of the hyperparameter tuning.
A logistic regression classifier was trained and used the mean area under the receiver operating characteristic curve (AUROC) scores across a group-stratified shuffle (N =100, 80/20 train/test split) for cross-validation, in which samples from subjects were held together in either train/test split (group), cohort labels were balanced across train/test split (stratified), and this process of train/test splitting was repeated n = 100 times (shuffle) and metric spread reported.
Since analyses were limited to fully deidentified recordings and records, only a small subset from the entire dataset was used for analysis. Considering recordings only from those who had dementia (clinically diagnosed dementia rating of 1, 2, or 3; n = 110) or CN (dementia rating of 0; n = 35), a cohort of 145 recordings emerged from which to test the predictive model (cohort demographics for all three recording groups with automated transcripts are provided in Supplementary Table 4).
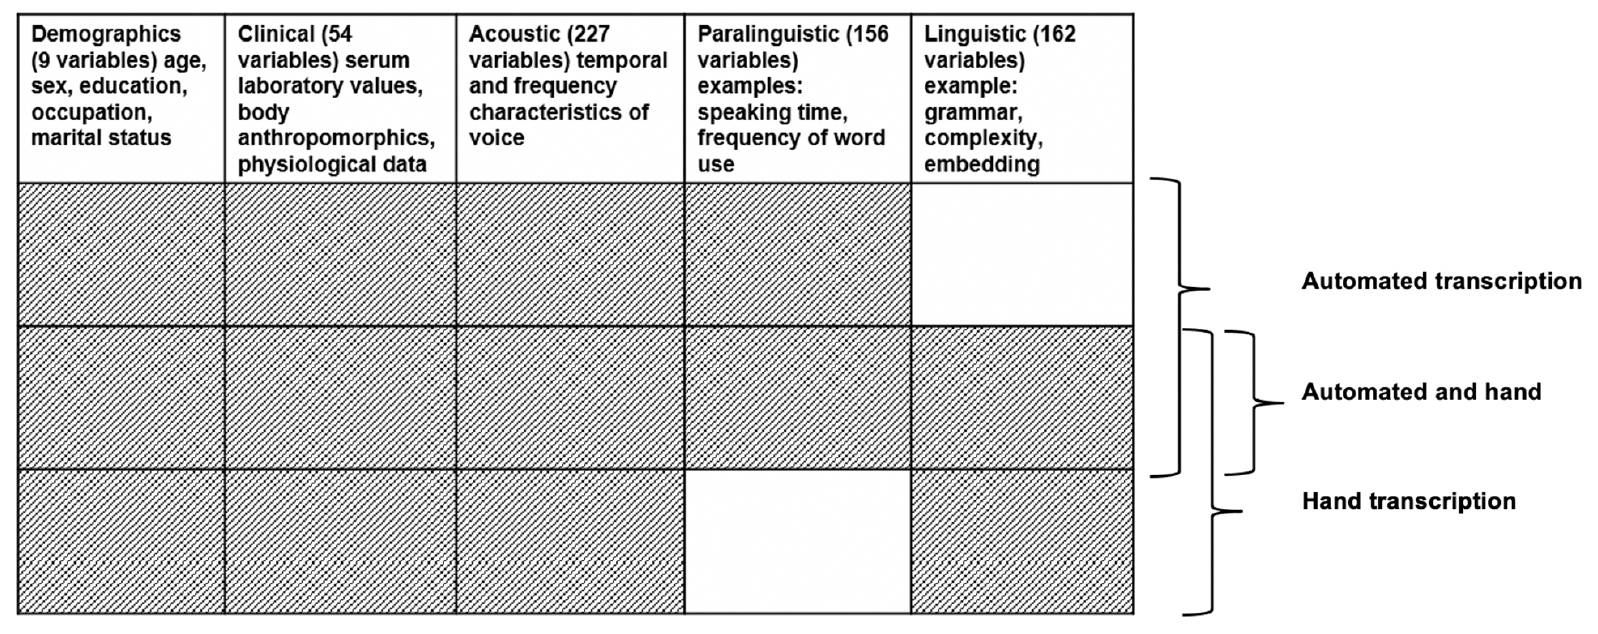
Figure 1. Description and availability of variables for different types of recordings (before selection)
Results
Automated transcription
We first considered the set of participants (n = 78) with a total of 200 automatically transcribed (via IBM Watson) recordings. The task was broken down into three binary classifications to discriminate between 1) CN controls and those with dementia, 2) CN and those with MCI, and 3) those with MCI versus dementia. (We also tried a single model with pairwise ranking objectives of CN < MCI < dementia, and the resulting area under the receiver operating characteristic curve [AUROC] for pairwise or 1-vs-all discrimination was comparable to the current approach.)
In computing the demographics for each set of transcripts, the same participant demographics could be represented in multiple subgroups. This stems from the fact that some participants contributed more than one recording and in subsequent recordings had progressed to MCI and/or dementia. CN persons (n = 35 recordings) had a median age of 83; those with MCI (N = 55 recordings), a median age of 81; and those with dementia (n = 110 recordings), a median age of 83. There were no significant differences among these recording subgroups in terms of age or sex distribution (Supplementary Table 4).
As seen in Figure 2, the use of demographic and clinical variables, alone or combined, yielded AUROC scores of < 0.70 in all comparisons. The scores for acoustic and paralinguistic variables each approached or exceeded 0.80. Putting all four types of variables together offered performance in the 0.80–0.90 AUROC range.
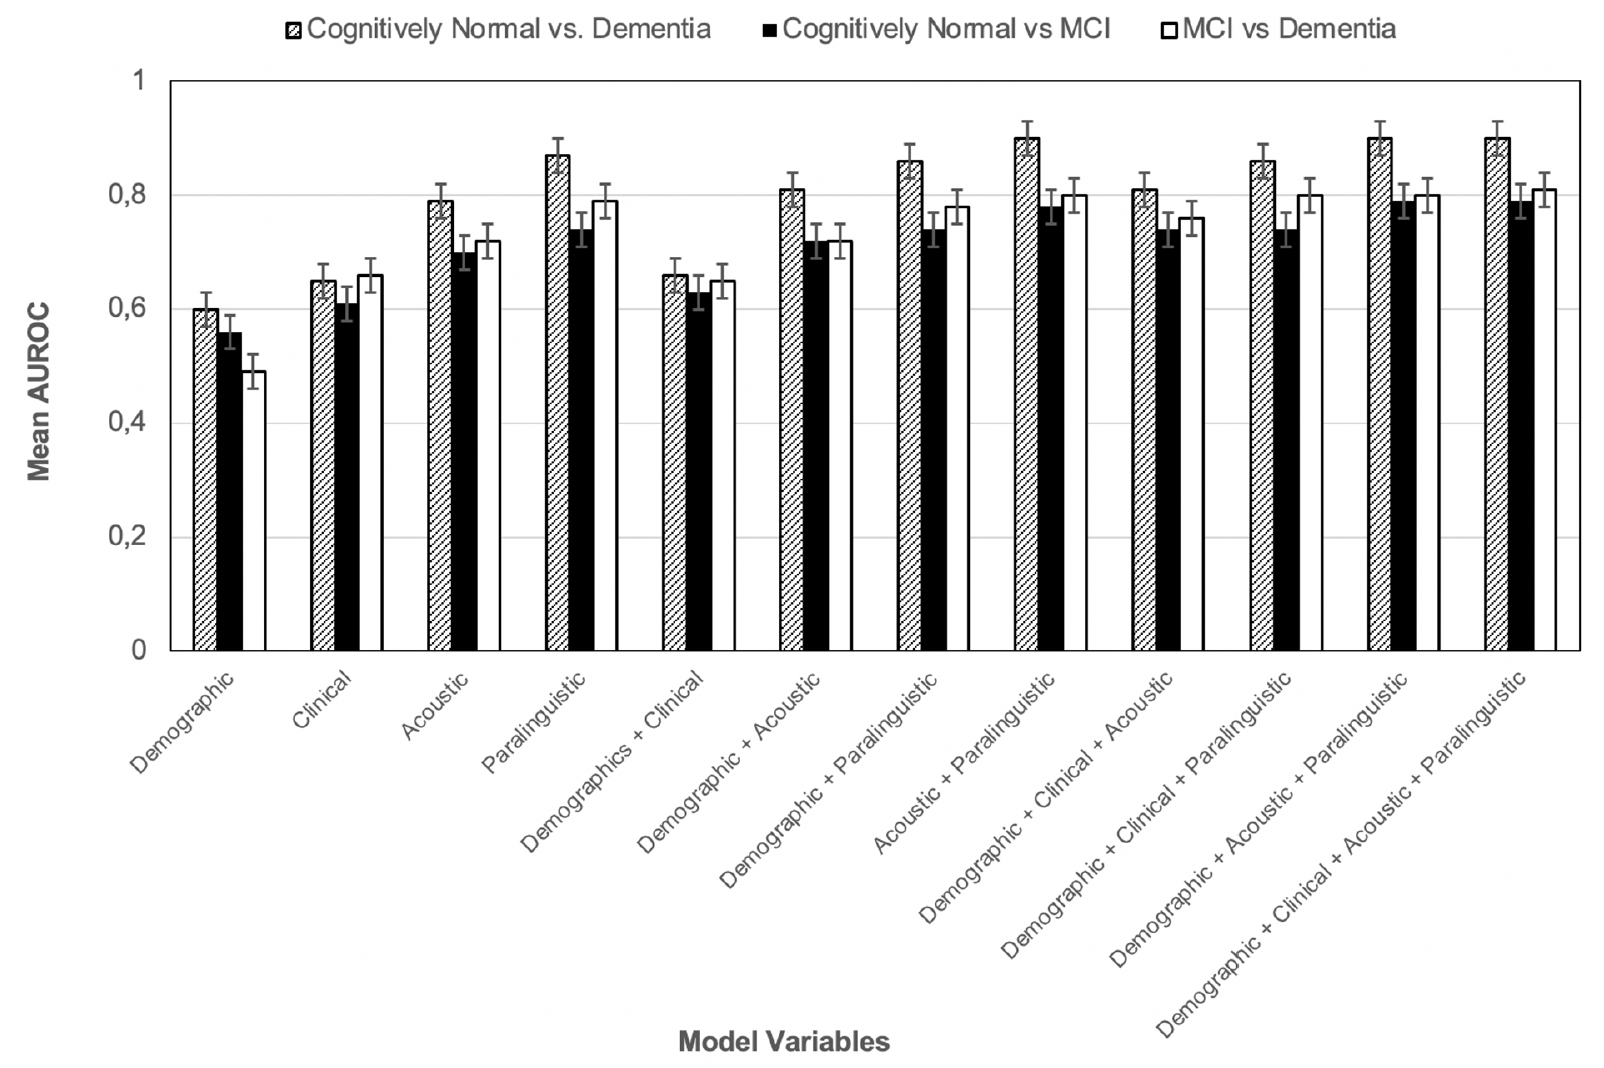
Figure 2. Mean area under the receiver operating characteristic (AUROC) curve and 95% CI for age- and sex-adjusted logistic regression models across 100 splits of group-stratified cross-validation, among participants with automated transcriptions
As an additional step of validation, we removed all MCI recording data and reran the CN-versus-dementia model for prediction. Figure 3 shows that the mean of predicted scores for MCI recordings lay between the two extreme groups, as expected. Similarly, CN-vs-MCI and MCI-vs-dementia models and their held-out samples are shown in Supplementary Figures 1 and 2, respectively.
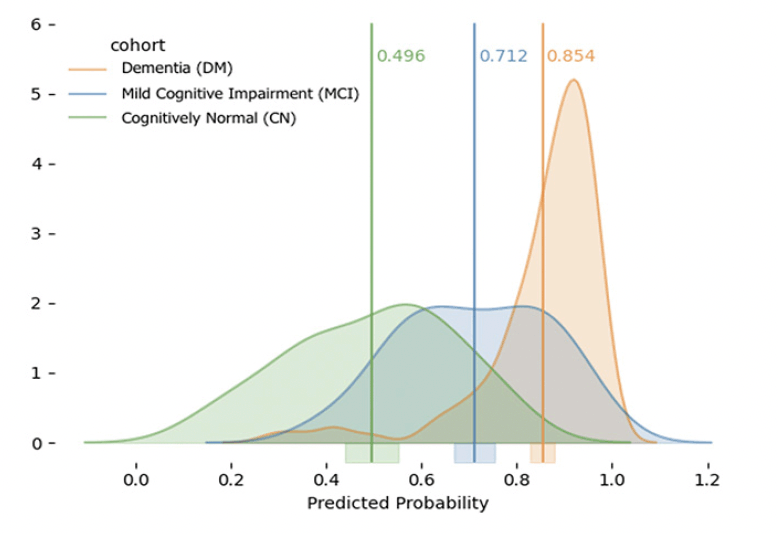
Figure 3. Predicted area under the receiver operating characteristic curves for participants with mild cognitive impairment, using the adjusted “Acoustic + Paralinguistic” logistic regression model discriminating healthy controls from those with dementia. The Y-axis represents the histogram count of subjects in the test set, and the vertical lines represent the means of the curves
Ultimately, across the various sets of variables, paralinguistic variables were the primary drivers of discrimination between CN recordings and dementia recordings, with an AUROC of 0.87 by themselves for this comparison. Variables selected to train logistic regression classifiers for CN versus MCI or dementia are shown in Figure 4. Of the 20 selected variables, 12 captured paralinguistic features (e.g., speaking time, section time, word mean time, etc.) from the interview and not from the content of the transcription. In addition, the selected variables belonged to different parts of the interview.
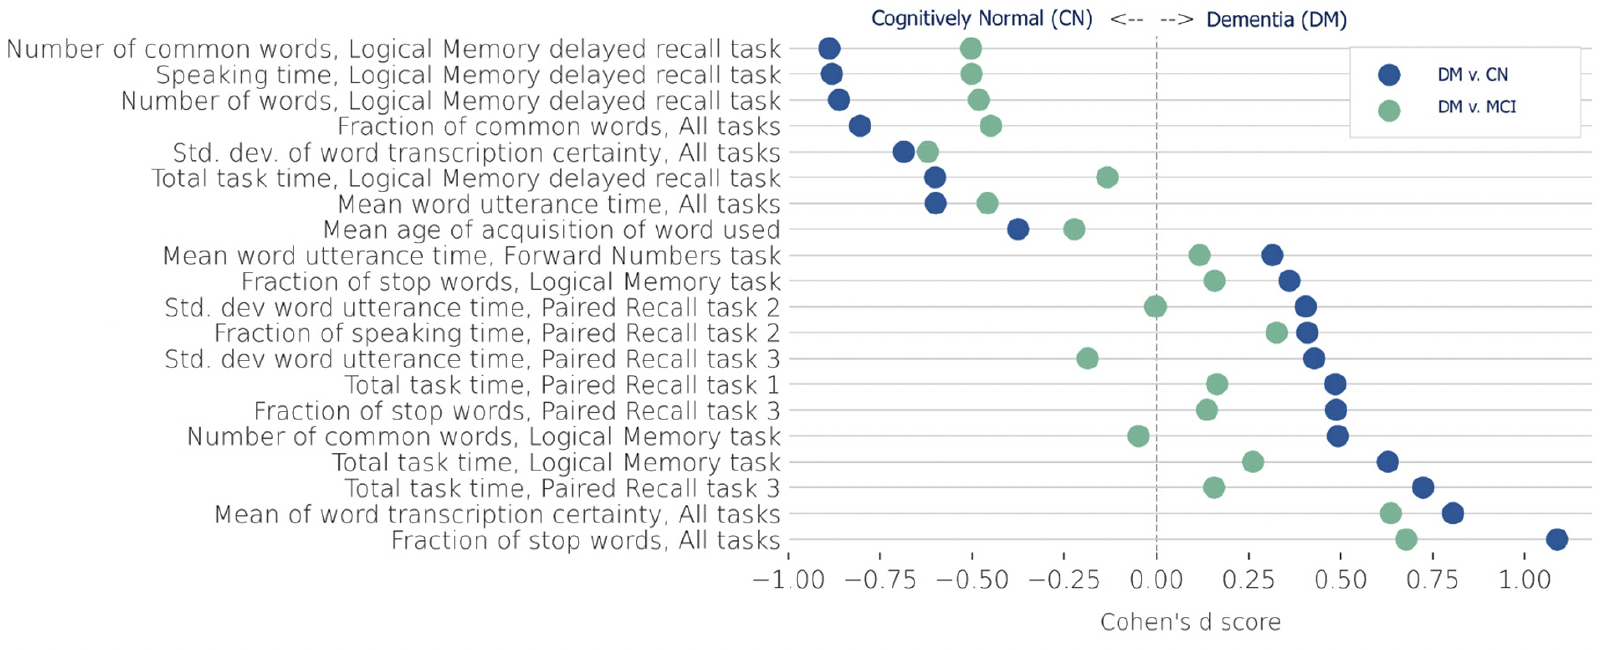
Figure 4. Paralinguistic variables used to train a logistic regression classifier for cognitively normal (CN) participants versus those with mild cognitive impairment (MCI; green circles) or dementia (DM; blue circles)
Of particular interest were the speaking time variables. Recordings from those with dementia usually lingered (“section_time” variables) on the Verbal Paired Associates task (Figure 4), but typically took half as long to complete the Logical Memory test, likely because fewer story details are recalled. Another major word feature was the fraction of stop words used throughout the full exam; recordings from participants with dementia were likely to include sentences with a higher rate of stop words, resulting in this variable being predictive of cognitive impairment. Word certainty, which indicates the level of confidence the Watson model has in transcribing the word, was much higher in the participants with dementia. Recordings from participants with dementia also had a low mean age of word acquisition, with high mean and low variance word certainty.
Manual transcriptions
Manual transcriptions (n = 127) were available for a subset of 113 participants. Manual transcription can reach higher accuracy than automated (IBM Watson-based) transcriptions, which often do not return coherent sentences needed for accurate grammar analysis.
Similar to Supplementary Table 4, Supplementary Table 5 provides demographics based on the demographics of the participant at the time of recording and some participants’ demographic information is duplicated in each of the 3 subgroups. Since only 9 recordings were from those with MCI, we merged their data with recordings from participants with dementia (n = 32) and compared to recordings from CN.
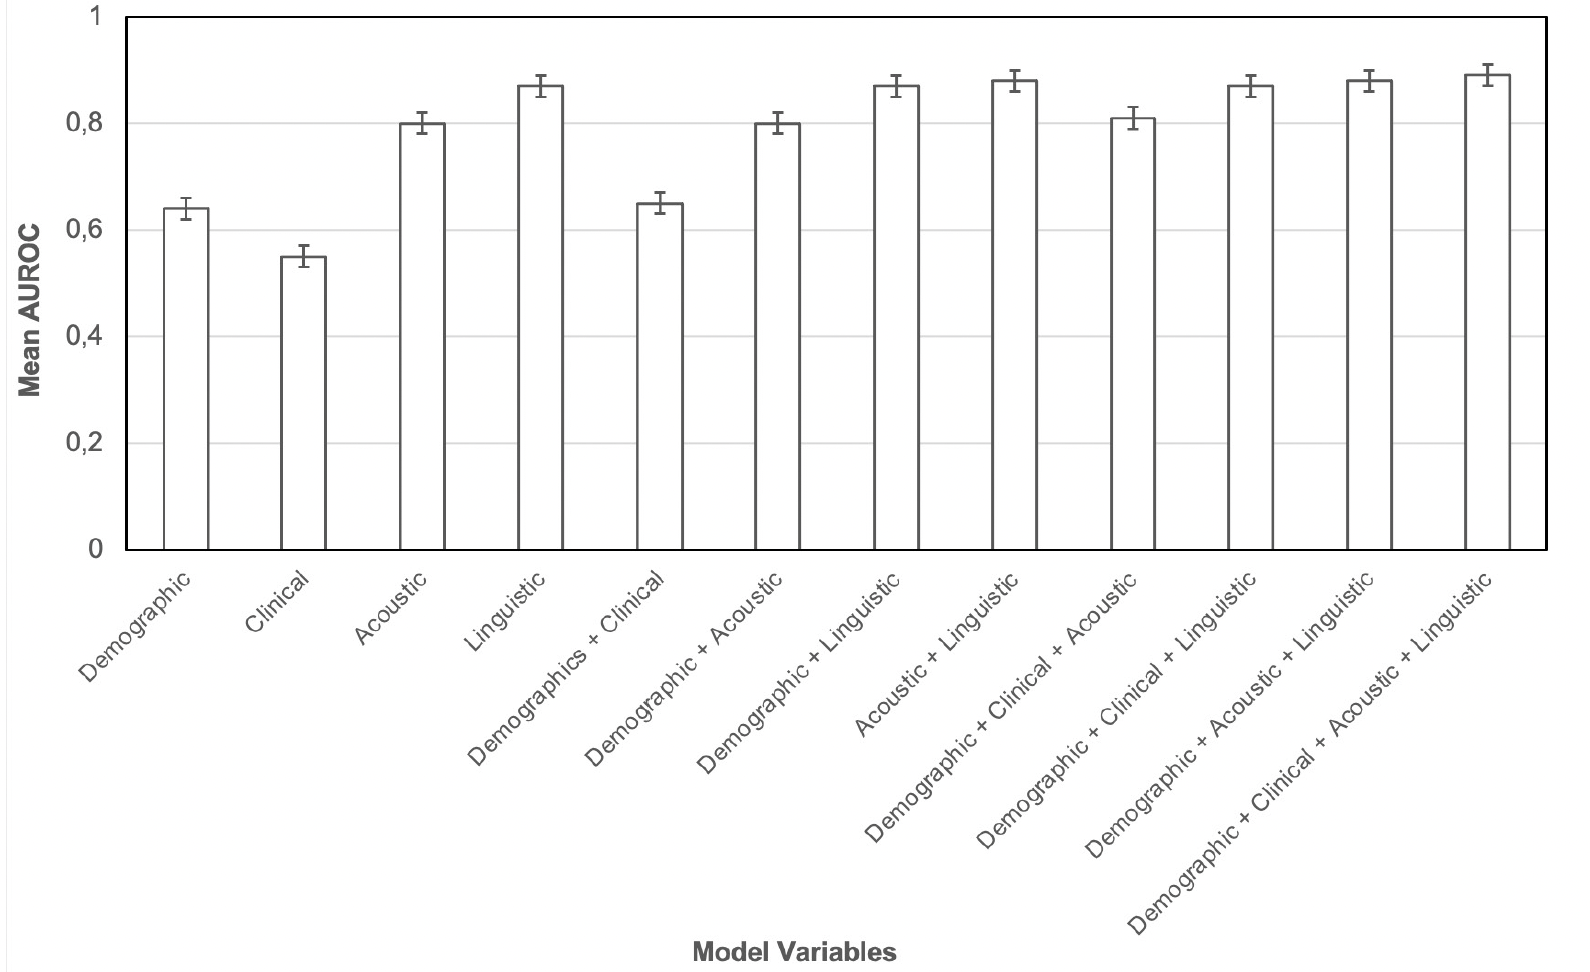
Figure 5. Mean area under the receiver operating characteristic curve (AUROC) and 95% CI for age- and sex-adjusted logistic regression models across 100 splits of group-stratified cross-validation, among participants with manual transcriptions
In this group, 49% of the recordings in CN were from participants 67 years or younger (the lowest age in the subgroup with cognitive impairment). To allow the de-confounding algorithm to work, we trained the model on data from recordings of participants older than 67 (total n = 85; Supplementary Table 6). Similar results were obtained in modelling the unfiltered dataset (data not shown). After excluding these samples, there were significantly more recordings of women in the subgroup with MCI or dementia (73% vs 50% in CN subgroup; P = 0.04).
As seen in Figure 5, demographic and clinical variables yielded AUROC scores < 0.70 for discrimination of CN recordings from recordings from those with cognitive impairment, both individually and when combined. Acoustic and linguistic variables each yielded AUROC scores ≥ 0.80, as did all other combinations of variable sets.
Similar to the automated-transcription findings, mean age of word acquisition appeared to be an important feature in the manually transcribed dataset (Figure 6). Overall, the results for linguistic variables in the manual-transcription dataset were similar to those for paralinguistic variables in the automated-transcription dataset for discriminating CN from recordings from those with cognitive impairment.
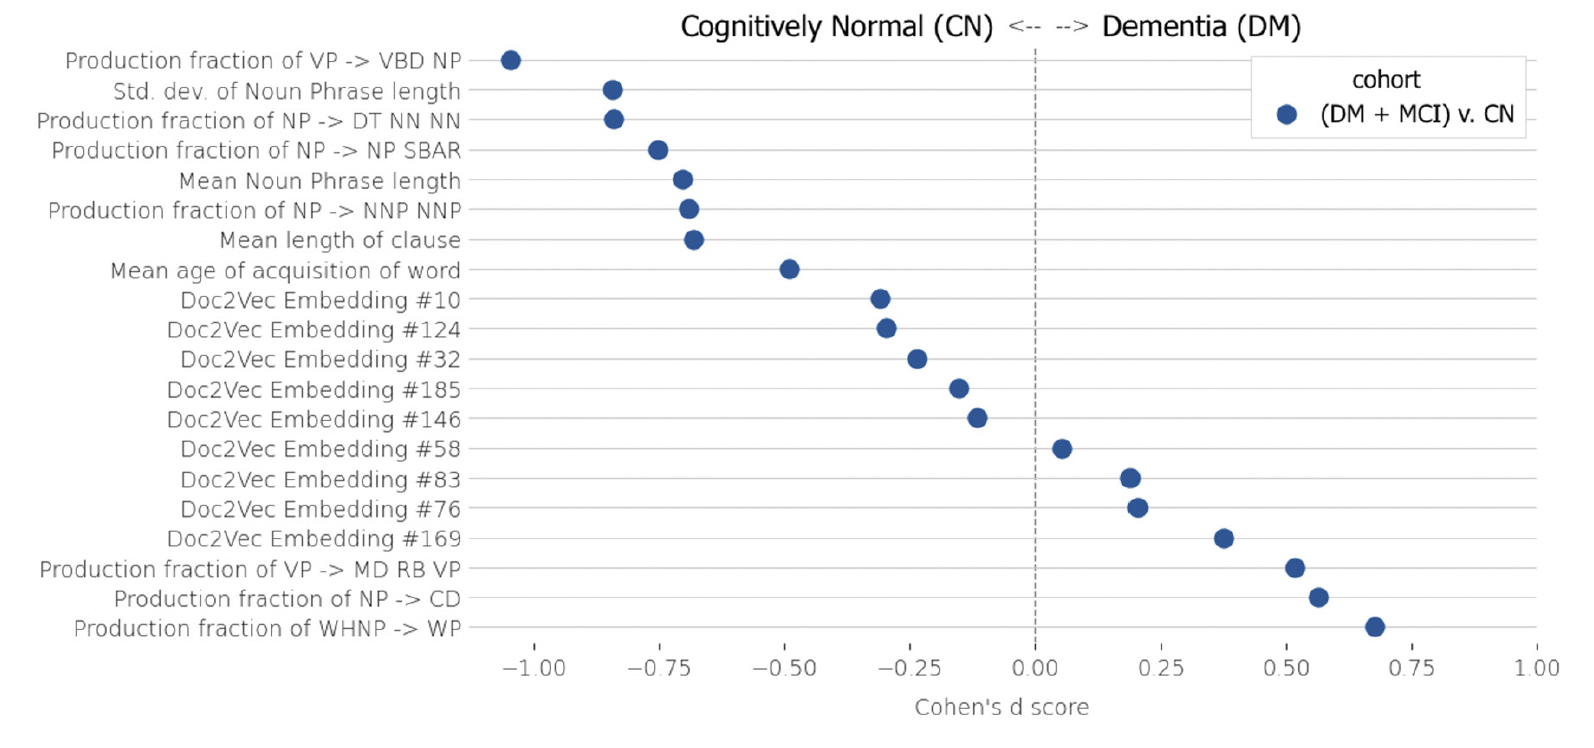
Figure 6. Linguistic variables used to train a logistic regression classifier for cognitively normal (CN) participants versus those with mild cognitive impairment (MCI) or dementia (DM)
Paralinguistic versus linguistic variables
Demographic characteristics of the 45 participants who had both manual and automated transcription data (n = 59 recordings) are shown in Supplementary Table 7; demographic data was duplicated from those participants who contributed recordings to more than one cognitive status group. Age and sex did not differ significantly by cognitive status in this common dataset.
Table 1 shows the results for modelling discrimination of recordings from CN from those with cognitive impairment. High-quality manual transcription from interviews improved model performance, both alone and combined with data from automated transcription, as would be expected.
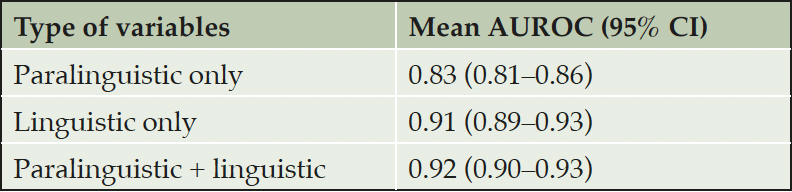
Table 1. Comparison of automatically transcribed paralinguistic features and manually transcribed linguistic features to discriminate between healthy controls (n = 22 recordings) and participants with mild cognitive impairment (MCI) or dementia (n = 37 recordings)
Discussion
This study illustrates how voice might be a useful tool in identifying persons with dementia. From a combination of linguistic, paralinguistic, acoustic, demographic, and clinical characteristics, it might be possible to predict cognitive status with a relatively high degree of certainty. Our models based on paralinguistic variables derived from automated transcription performed better (AUROC 0.87) than those based on simple acoustic variables (AUROC 0.79). In addition, when a good manual transcription was available, natural language processing techniques and embeddings significantly improved predictive accuracy (AUROC 0.92 in the common subset). Thus, these models might be applicable to a variety of situations ranging from low-quality audio captured over phone conversations to high-fidelity transcriptions of in-person visits.
This retrospective study adds to recent research and applications proposing the use of voice as a digital biomarker for disease progression and screening not only for dementia (25, 26) but also across therapeutic areas (27-29). Digital biomarkers can be measured in real time and are generally less expensive to compute—automated transcription of neurophysiological tests costs ~$1 per 15-minute sample compared with $2 per minute for manual transcription—and less invasive than traditional biomarkers.
While these initial findings are promising, experiments must be repeated with larger digital datasets of medical and audio samples on which to train and test algorithms and in more racially and culturally diverse populations. In addition, better audio quality will translate to more accurate automated diarization and transcriptions and will enhance the specificity of variables computed purely on acoustic patterns. Supplementing the dataset with other health-related data sources (e.g., minute-level heart rate and steps) is also recommended for future prospective studies, to provide even better contextualization data to enhance accurate clinical interpretation of digital biomarkers (30). Finally, while the current work shows good discrimination power of the models proposed, further research is needed to study model calibration to specific applications and settings (31).
The implications of this study are potentially globally significant. There is currently no single assessment method that can be applied uniformly regardless of a person’s age, sex/gender, education, language, or culture. All current cognitive screening and more comprehensive neuropsychological test protocols are confounded by these factors. Recording of voice is possible even in the lowest-resourced settings. Further, speech production, which involves multiple cognitive domains, is a skill that most people are able to do. Thus, digital voice indices could perhaps serve as highly predictive digital voice biomarkers of Alzheimer’s disease, possibly providing a low-cost, easily scalable worldwide solution to address persistent health disparities in diagnosis, treatment, and clinical studies of cognition-related disorders. Importantly, the possibility of an economical and accessible voice-based digital biomarker test for cognitive impairment could allow early detection in people who have not yet met the threshold for clinical symptoms and trigger interventions that can alter the trajectory of change or prevent disease altogether. As research is translated into practice, applications must be built with a privacy-first approach, as voice is arguably the carrier of the most sensitive information pertaining to an individual.
Funding: This work was supported by Defense Advanced Research Projects Agency contract FA8750-16-C-0299 (D.S., A.S., M.S., C.L., R.K., L.F.); National Heart, Lung, and Blood Institute contracts N01-HC-25195 and HHSN268201500001I and National Institute on Aging grants R01-AG016495, R01-AG008122, R01AG049810, RF1AG054156, R01 AG062109, and U19 AG068753 (all R.A.). The sponsors had no role in the design and conduct of the study; in the collection, analysis, and interpretation of data; in the preparation of the manuscript; or in the review or approval of the manuscript.
Acknowledgments: The authors would like to thank Filip Jankovic for engineering support.
Conflict of interest disclosure: Drs. Stück, Signorini, Kainkaryam, and Foschini and Ms. Lemke and Ms. Sandoval are employees of Evidation Health, Inc., a company whose mission is to measure health in everyday life using technology. Dr. Au is a scientific advisor to Signant Health and Biogen; none of the current work described is related to her advisory roles. All other authors declare no conflict of interest.
Ethical standard: The study protocol was approved by the Institutional Review Board of Boston University, Boston, Massachusetts, and the research was conducted in accordance with the Helsinki Declaration.
Open Access: This article is distributed under the terms of the Creative Commons Attribution 4.0 International License (http://creativecommons.org/licenses/by/4.0/), which permits use, duplication, adaptation, distribution and reproduction in any medium or format, as long as you give appropriate credit to the original author(s) and the source, provide a link to the Creative Commons license and indicate if changes were made.
Open Access: This article is distributed under the terms of the Creative Commons Attribution 4.0 International License (http://creativecommons.org/licenses/by/4.0/), which permits use, duplication, adaptation, distribution and reproduction in any medium or format, as long as you give appropriate credit to the original author(s) and the source, provide a link to the Creative Commons license and indicate if changes were made.
References
1. Alzheimer’s Disease International. World Alzheimer Report 2015: The Global Impact of Dementia: An Analysis of Prevalence, Incidence, Cost and Trends. 2015. Alzheimer’s Disease International, London.
2. Wilson D, Peters R, Ritchie K, Ritchie CW. Latest advances on interventions that may prevent, delay or ameliorate dementia. Ther Adv Chronic Dis. 2011;2(3):161-173. https://doi.org/10.1177/2040622310397636
3. Zissimopoulos J, Crimmins E, St. Clair P. The value of delaying Alzheimer’s disease onset. Forum Health Econ Policy. 2014;18(1):25-39. https://doi.org/10.1515/fhep-2014-0013
4. Livingston G, Huntley J, Sommerlad A, et al. Dementia prevention, intervention, and care: 2020 report of the Lancet Commission. Lancet. 2020;396(10248):413-446. https://doi.org/10.1016/s0140-6736(20)30367-6
5. Kourtis LC, Regele OB, Wright JM, Jones GB. Digital biomarkers for Alzheimer’s disease: the mobile/wearable devices opportunity. npj Digit Med. 2019;2:9. https://doi.org/10.1038/s41746-019-0084-2
6. Shuren J, Doraiswamy PM. Digital therapeutics for MCI and Alzheimer’s disease: a regulatory perspective—Highlights From The Clinical Trials on Alzheimer’s Disease conference (CTAD). J Prev Alzheimers Dis. 2022;9:236-240. https://doi.org/10.14283/jpad.2022.28
7. Coravos A, Goldsack JC, Karlin DR, et al. Digital medicine: a primer on measurement. Digit Biomark. 2019;3(2):31-71. https://doi.org/10.1159/000500413
8. Amazon Transcribe Medical pricing. https://aws.amazon.com/transcribe/pricing/
9. Eyigoz E, Mathur S, Santamaria M, Cecchi G, Naylor M. Linguistic markers predict onset of Alzheimer’s disease. EClinicalMedicine. 2020;28:100583. https://doi.org/10.1016/j.eclinm.2020.100583
10. Splansky GL, Corey D, Yang Q, et al. The third generation cohort of the National Heart, Lung, and Blood Institute’s Framingham Heart Study: design, recruitment, and initial examination. Am J Epidemiol. 2007;165(11):1328-1335. https://doi.org/10.1093/aje/kwm021
11. Satizabal CL, Beiser AS, Chouraki V, Chêne G, Dufouil C, Seshadri S. Incidence of dementia over three decades in the Framingham Heart Study. N Engl J Med 2016;374(6):523-532. https://doi.org/10.1056/nejmoa1504327
12. Au R, Piers RJ, Devine S. How technology is reshaping cognitive assessment: Lessons from the Framingham Heart Study. Neuropsychology. 2017;31(8):846-861. https://doi.org/10.1037/neu0000411
13. Farmer ME, White R, Kittner SJ, et al. Neuropsychological test performance in Framingham: a descriptive study. Psychol Rep. 1987;60(3 Pt 2):1023-1040. https://doi.org/10.1177/0033294187060003-201.1
14. Eyben F, Weninger F, Gross F, Schuller B. Recent developments in openSMILE, the Munich open-source multimedia feature extractor. Proceedings of the 21st ACM International Conference on Multimedia. 2013:835-838. https://doi.org/10.1145/2502081.2502224
15. Schuller B, Steidl S, Batliner A, et al. Paralinguistics in speech and language—state-of-the-art and the challenge. Comput Speech Lang. 2013;27(1):4-39. https://doi.org/10.1016/j.csl.2012.02.005
16. Stadthagen-Gonzalez H, Davis CJ. The Bristol norms for age of acquisition, imageability, and familiarity. Behav Res Methods. 2006;38(4):598-605. https://doi.org/10.3758/bf03193891
17. Le Q, Mikolov T. Distributed representations of sentences and documents. Proceedings of the 31st International Conference on Machine Learning, PMLR. 2014;32:1188-1196. https://dl.acm.org/doi/10.5555/3044805.3045025
18. Charniak E, Johnson M. Coarse-to-fine n-best parsing and MaxEnt discriminative reranking. Proceedings of the 43rd Annual Meeting of the Association for Computational Linguistics. 2005:173-180. https://doi.org/10.3115/1219840.1219862
19. Pitler E, Nenkova A. Revisiting readability: a unified framework for predicting text quality. Proceedings of the Conference on Empirical Methods in Natural Language Processing. 2008:186-195. https://dl.acm.org/doi/10.5555/1613715.1613742
20. Fraser KC, Hirst G, Meltzer JA, Mack JE, Thompson CK. Using statistical parsing to detect agrammatic aphasia. Proceedings of the 2014 Workshop on Biomedical Natural Language Processing (BioNLP). 2014:134-142. http://dx.doi.org/10.3115/v1/W14-3420
21. Bird S. NLTK: the natural language toolkit. Proceedings of the COLING/ACL on Interactive Presentation Sessions. 2006:69-72. http://dx.doi.org/10.3115/1225403.1225421
22. Lu X. Automatic analysis of syntactic complexity in second language writing. Int J Corpus Linguist. 2010;15(4):474-496. https://doi.org/10.1075/ijcl.15.4.02lu
23. Feldman M, Friedler SA, Moeller J, Scheidegger C, Venkatasubramanian S. Certifying and removing disparate impact. Proceedings of the 21th ACM SIGKDD International Conference on Knowledge Discovery and Data Mining. 2015:259-268. https://doi.org/10.1145/2783258.2783311
24. Ding C, Peng H. Minimum redundancy feature selection from microarray gene expression data. J Bioinform Comput Biol. 2005;3(2):185-205. https://doi.org/10.1142/s0219720005001004
25. Gold M, Amatniek J, Carrillo MC, et al. Digital technologies as biomarkers, clinical outcomes assessment, and recruitment tools in Alzheimer’s disease clinical trials. Alzheimers Dement (N.Y.). 2018;4:234-242. https://doi.org/10.1016/j.trci.2018.04.003
26. Fraser KC, Meltzer JA, Rudzicz F. Linguistic features identify Alzheimer’s disease in narrative speech. J Alzheimers Dis. 2016;49(2):407-422. https://doi.org/10.3233/jad-150520
27. Lansford KL, Liss JM. Vowel acoustics in dysarthria: speech disorder diagnosis and classification. J Speech Lang Hear Res. 2014;57(1):57-67. https://doi.org/10.1044/1092-4388(2013/12-0262)
28. Rutkove SB, Narayanaswami P, Berisha V, et al. Improved ALS clinical trials through frequent at-home self-assessment: a proof of concept study. Ann Clin Transl Neurol. 2020;7:1148-1157. https://doi.org/10.1002/acn3.51096
29. Liss JM, Krein-Jones K, Wszolek ZK, Caviness JN. Speech characteristics of patients with pallido-ponto-nigral degeneration and their application to presymptomatic detection in at-risk relatives. Am J Speech Lang Pathol. 2006;15(3):226-235. https://doi.org/10.1044/1058-0360(2006/021
30. Chen R, Jankovic F, Marinsek N, et al. Developing measures of cognitive impairment in the real world from consumer-grade multimodal sensor streams. Proceedings of the 25th ACM SIGKDD International Conference on Knowledge Discovery & Data Mining. 2019:2145-2155. https://dl.acm.org/doi/10.1145/3292500.3330690
31. Steyerberg EW. Calibration. In: Clinical Prediction Models: A Practical Approach to Development, Validation, and Updating. Springer Science + Business Media LLC. New York, 2009, pp 270-278.