
C. Udeh-Momoh1,2,†, B. Zheng1,†, A. Sandebring-Matton1,2,3, G. Novak4, M. Kivipelto1,2,5,6, L. Jönsson3, L. Middleton1,7 for the Alzheimer’s Disease Neuroimaging Initiative*
1. Ageing Epidemiology Research Unit, School of Public Health, Imperial College London, London, UK; 2. Division of Clinical Geriatrics, Center for Alzheimer Research, Department of Neurobiology, Care Sciences and Society, Karolinska Institutet, Stockholm, Sweden; 3. Division of Neurogeriatrics, Department of Neurobiology, Care Sciences and Society, Karolinska Institutet, Stockholm, Sweden; 4. Janssen Research & Development, LLC, Titusville, USA; 5. Public Health Promotion Unit, National Institute for Health and Welfare (THL), Helsinki, Finland; 6. Institute of Clinical Medicine, Neurology, University of Eastern Finland, Kuopio, Finland; 7. Public Health Directorate, Imperial College NHS Healthcare Trust, London, UK. † co-first authors; * Data used in preparation of this article were obtained from the Alzheimer’s Disease Neuroimaging Initiative (ADNI) database (adni.loni.usc.edu). As such, the investigators within the ADNI contributed to the design and implementation of ADNI and/or provided data but did not participate in analysis or writing of this report. A complete listing of ADNI investigators can be found at: http://adni.loni.usc.edu/wp-content/uploads/how_to_apply/ADNI_Acknowledgement_List.pdf
Corresponding Author: Prof. Lefkos Middleton, Ageing Epidemiology Research Unit, School of Public Health, Faculty of Medicine, Imperial College London, London W6 8RP, UK. E-mail: l.middleton@imperial.ac.uk; Tel: +44 20 3311 0216; Fax: +44 20 3311 0216.
J Prev Alz Dis 2022;1(9):12-21
Published online December 20, 2021, http://dx.doi.org/10.14283/jpad.2021.70
Abstract
Background: Reliable, widely accessible and affordable biomarkers for predicting Alzheimer’s disease (AD) brain pathology status are a necessity to aid development of prevention strategies in cognitively healthy at-risk older adults, at the right timepoint. Measurements of the key neuropathological hallmark beta-amyloid (Aβ) by PET neuroimaging or cerebrospinal fluid measures reflect its accumulation in the brain, yet recent methodological advancements now enable blood-based measures reflecting cerebral amyloid burden.
Objectives: The current study validated the capacity of plasma Aβ42/Aβ40 measured using six different assays to predict amyloid positivity in a subgroup of cognitively unimpaired (CU) participants in the ADNI study and assessed its ability to discriminate CU from AD cases. We also explored economic viability of using two different plasma amyloid assays for pre-screening in AD prevention trials and as routine clinical diagnostic tool, versus amyloid PET alone.
Design: A cross-sectional analysis of plasma and brain amyloid data, including comparative cost analysis of the plasma biomarkers in relation to brain amyloid PET.
Setting: Alzheimer’s Disease Neuroimaging Initiative (ADNI).
Participants: ADNI participants consisting of 115 CU, mild cognitive impairment and AD cases who had plasma Aβ42/Aβ40 measured with six platforms.
Measurements: Plasma Aβ42/Aβ40 was measured via six different platforms: three immunoassays (Roche, Quanterix and ADx Neurosciences) and three mass spectrometry (MS) based assays (WashU, Shimadzu and Gothenburg). Aβ-PET imaging was conducted within three months of plasma sampling using [18F]florbetapir.
Results: There was a weak to moderate correlation of plasma Aβ42/Aβ40 ratio between platforms. The MS-based WashU test had the highest capacity to discriminate between CU and AD (area under the curve, AUC = 0.734, 95% CI: 0.613-0.854; P = 0.008). Within the CU group, the WashU plasma amyloid test had the best discriminative capacity to distinguish Aβ+ from Aβ– (AUC = 0.753, 95% CI: 0.601-0.905; P = 0.003) closely followed by the immunoassay from Roche (AUC = 0.737, 95% CI: 0.597-0.877; P = 0.006). The exploratory economic analyses showed that the use of Roche or WashU plasma amyloid assay as a pre-screening tool prior to Aβ-PET scans for clinical trial recruitment significantly reduced total screening cost (saving up to $5882 per recruited patient) expected in an AD prevention trial.
Conclusions: With few available treatment strategies, dementia prevention is a global priority. CU individuals at risk for AD are the target population for dementia prevention but have been poorly studied. Our findings confirming diagnostic value of ultrasensitive immunoassays and high-performance immunoprecipitation coupled with MS for measurement of plasma Aβ42/Aβ40 to detect PET amyloid positivity in CU participants allude to potential clinical utility of this biomarker. Plasma Aβ42/Aβ40 could be optimal for pre-selecting at-risk candidates for more invasive and expensive investigations across AD prevention clinical trials and clinical care for a rapidly ageing population.
Key words: Plasma Aβ42/Aβ40, diagnostic biomarker, AD prevention, cognitively unimpaired, economic analysis.
Introduction
With the development of new anti-amyloid therapies moving towards the earliest clinical and the preclinical Alzheimer’s disease (AD) stages, accessible, cost-effective and reliable technologies targeting at-risk populations for AD clinical trials are urgently required [reviewed in (1)]. Trial screening procedures will benefit from strategic selection of the ‘right’ candidates who are more likely to have detectable in vivo high brain amyloid pathology burden–indicative of biological AD (2), as per the 2018 NIA-AA criteria (3), i.e. low levels of the 42-amino acid length amyloid-β peptide isoform Aβ42 in cerebrospinal fluid (CSF) (4), or above threshold radioligand binding of cortical Aβ plaques assessed via Positron Emission Tomography (PET) (5). Notably, such studies that still represent the gold standard for ante-mortem detection of amyloid deposition, are not without significant limitations; PET scans are expensive and still not widely available, whereas CSF sampling through lumbar punctures is seen as invasive and unappealing. Blood-based prediction of brain amyloid pathology would offer several advantages, including wider availability, the ability of repeated acquisitions for validation and for response monitoring, and lower cost. Blood based biomarkers could be ideal as pre-screening tools for the selection of study participants likely to have abnormal PET and CSF amyloid levels, among cognitively healthy adults for prevention-based randomised control trials, i.e. disease modifying therapies. Furthermore, they could prove valuable in contributing to the characterisation and identification of at risk-for AD individuals for public health preventative strategies, involving non-pharmacological interventions.
Recent advancements in the biochemical assays of Aβ in blood-based biofluids (serum, plasma) via ultra-sensitive immunoassays (IA) and targeted mass-spectrometry (MS) have engendered remarkable Aβ blood tests with proven accuracy for detecting brain amyloid pathological status, as confirmed via PET or CSF (6-16); discriminating AD from cognitive normal status (15), as well as predicting cognitive decline (6, 17) and clinical progression (18); alluding to high potential for clinical use. Of the variations of amyloid protein, including precursors and independent Aβ isoform types investigated, plasma Aβ42/Aβ40 ratio has been shown to reliably predict abnormal cerebral amyloid deposition in non-demented older adults, with the MS based platforms shown to provide the most robust results of AUCs reported up to 0.88 (11, 19) also in a recent multi-cohort head-to-head comparison of multiple platforms (8). At the same time, specialised automated IAs have reliably detected brain amyloid PET pathology status in cognitively unimpaired subjects with high precision, reporting AUCs in the range of 0.81-0.89 (13, 14, 20), with diagnostic performance significantly enhanced with the addition of apolipoprotein E (APOE) ε4 status. The wealth of information on the diagnostic accuracy of plasma Aβ42/Aβ40 ratio for detecting cases of Aβ PET positivity holds promise for translation of this biomarker from primary utility in research, to use within clinical and population-based settings; therefore, studies in preclinical populations are essential.
Additionally, selection of at-risk individuals from population-based cohorts will require capacity to delineate cognitively healthy from pre-dementia cases using high-throughput screening strategies which cost-effective and sensitive blood markers may confer. Though shown to accurately predict brain amyloidosis even in cognitively healthy individuals, the clinical utility of plasma Aβ42/Aβ40 ratio for distinguishing AD cases from controls has been less studied until recently, with inconsistent results of null findings (15) versus significant discrimination capacity (20) reported, possibly stemming from methodological disparities.
Here we address this gap by leveraging the recent Alzheimer’s disease Neuroimaging Initiative (ADNI) report on the diagnostic accuracy of plasma Aβ42/Aβ40 ratio measured across distinct platforms for detecting brain Aβ burden in older adults across the AD clinical continuum (8). By focusing on cognitively normal individuals (21), we aimed to compare plasma Aβ42/Aβ40 measured via three IAs and three MS based platforms for effectiveness in determining brain Aβ PET positivity status. As an exploratory objective, we assessed the abilities of these six plasma Aβ assays to distinguish cognitively unaffected participants from clinical AD cases. We further evaluated the cost-effectiveness of the best performing MS-based and IA-based plasma Aβ42/Aβ40 assays in our analysis for detecting likelihood of brain Aβ PET positivity status in the contexts of AD prevention trials and as part of routine clinical care. Our results may inform enrichment strategies for pre-screening candidates to undergo confirmatory brain amyloid evaluations in AD prevention trials.
Methods
Data source and participants
The data used in this study were obtained from the Alzheimer Disease Neuroimaging Initiative (ADNI) database (adni.loni.usc.edu). The ADNI was launched in 2003 and for up-to-date information, please see www.adni-info.org. The full list of inclusion/exclusion criteria for ADNI cohorts can be accessed through the online ADNI protocol (http://adni.loni.usc.edu/methods/documents/). Written informed consent was obtained from all participants. This study included a subset of 115 participants who had valid plasma Aβ assessments measured across six platforms (three spectrometry-based assays and three IAs (described in (8)), with the plasma samples obtained between January 2016 and January 2018.
Diagnostic groups and Aβ-PET imaging
Clinical diagnostic status of AD, mild cognitive impairment (MCI) or cognitively unimpaired (CU) in ADNI participants was based on multiple cognitive tests (see ADNI protocol at http://adni.loni.usc.edu/methods/documents/). Given that the diagnostic status of ADNI participants was updated at each follow-up visit, we extracted the more recent diagnostic group information prior to plasma sampling time for these 115 participants (matched by unique ID and visit code).
Among the 115 participants, 113 had valid Aβ-PET imaging close to the time of plasma sampling (within three months; matched by unique ID and visit code). The Aβ-PET imaging was performed using [18F]florbetapir (8). Here, Aβ positive group was defined as centiloid ≥ 22; Aβ negative group was defined as centiloid < 22 as per (22).
Plasma Aβ assessments
Six assays were used to measure plasma Aβ42 and Aβ40 for these 115 participants in a blinded fashion: an immunoprecipitation-coupled mass spectrometry (IP-MS) assay developed by Washington University (WashU), an immunoprecipitation combined with matrix-assisted laser desorption/ionization time-of-flight mass spectrometry (IP-MALDI-TOF-MS) assay from Shimadzu, an IP-MS assay from the University of Gothenburg, and three IAs from Roche Diagnostics (Elecsys Neuro Toolkit), ADx Neurosciences (Simoa Neuro 4-plex E kit), and Quanterix (Simoa Aβ40 and Aβ42 Advantage Kit). The Aβ42/Aβ40 ratio was calculated from the independent Aβ42 and Aβ40 measures from each platform.
In addition, information on age, sex, education years and APOE genotype was extracted for the analyses.
Statistical analyses
Demographic and clinical characteristics of participants are described by diagnostic groups and further stratified by amyloid positivity status specifically for the CU group. Pearson correlation coefficients of Aβ42/Aβ40 ratio between the six assays were calculated in both the full sample and CU group only.
With the focus of informing risk-for-AD status of cognitively healthy older adults, we assessed the discriminative ability of Aβ42/Aβ40 ratio from each platform for amyloid positivity (Aβ-PET positive vs negative) in CU study participants using receiver operating characteristic (ROC) curve analyses. The area under the curve (AUC) and its 95% confidence interval were estimated for each platform. In addition, we estimated the AUCs of age alone and a prediction score based on age and APOE ε4 (derived from a binary logistic regression for Aβ-PET positivity) for comparison purpose. The optimal cut-off points of Aβ42/Aβ40 ratio for calculating sensitivity and specificity was determined by Youden index (i.e., through maximising the sum of sensitivity and specificity). We also explored the discriminative ability of Aβ42/Aβ40 ratio for amyloid positivity in participants with MCI.
As an exploratory analysis, we assessed the discriminative ability of plasma Aβ42/Aβ40 ratio for diagnostic status (AD vs CU or AD vs CU+MCI) using similar ROC curves, in comparison with the discriminative performances of PET centiloid value (continuous variable), age alone and the composite score of age and APOE ε4.
Finally, an exploratory economic analysis was conducted in two hypothetical settings: screening for clinical trial recruitment and population-based prevention programmes, respectively. We compared three diagnostic strategies: the WashU or the Roche assays followed by a PET scan in subjects testing positive on the assay vs a scenario of conducting PET scans without prior pre-selection based on plasma Aβ assays. The prevalence of amyloid positivity in the elderly population was set at 27% (23).
For each assay, the cut-off point was selected to minimise the overall screening cost, i.e. the costs for the expected number of PET scans and the expected number of plasma assays required to identify one eligible patient. The positive predictive value (PPV) is the number of true positives among all that test positive on the assay and go on to receive a PET scan. The inverse of the PPV indicates how many PET scans will be required to find one eligible patient with a positive PET scan. For the ‘PET only’ option, the expected number of scans is instead the inverse of the population prevalence (1/0.27=3.70). We calculated the number of plasma assays needed to identify one eligible patient as the inverse of the proportion of positive plasma assays multiplied by the inverse of the PPV. The total cost of screening is the expected cost of plasma assays plus the expected cost of PET scans to identify one eligible patient.
The statistical analyses were performed using SPSS version 22 (SPSS Inc., Chicago, IL, USA). All statistical tests were two-sided, and the statistical significance was defined as P < 0.05.
Results
Population characteristics
Among the 115 participants included, 48 (42%) were CU, 55 (48%) had MCI and 12 (10%) had AD at the time of plasma sampling. 49 (43%) of the 115 participants were female, 46 (40%) were APOE ε4 carriers, and 58 (51%) were Aβ positive based on PET imaging. The mean age was 78.7 years and the mean education level was 16.4 years. The characteristics across the four groups based on diagnostic or amyloid status are displayed in Table 1. The box plots of plasma Aβ42/Aβ40 ratio from the six platforms across the four groups are presented in Supplementary Figure 1.
The plasma Aβ42/Aβ40 ratios across the six platforms had weak to moderate correlation with each other (r ranging from 0.05 between ADx and Gothenburg to 0.63 between ADx and Roche); the results from WashU had relatively higher correlation with all other 5 platforms (r ranging from 0.33 to 0.51; P < 0.001). Similar patterns were also observed in the subset of CU participants (Supplementary Table 1).
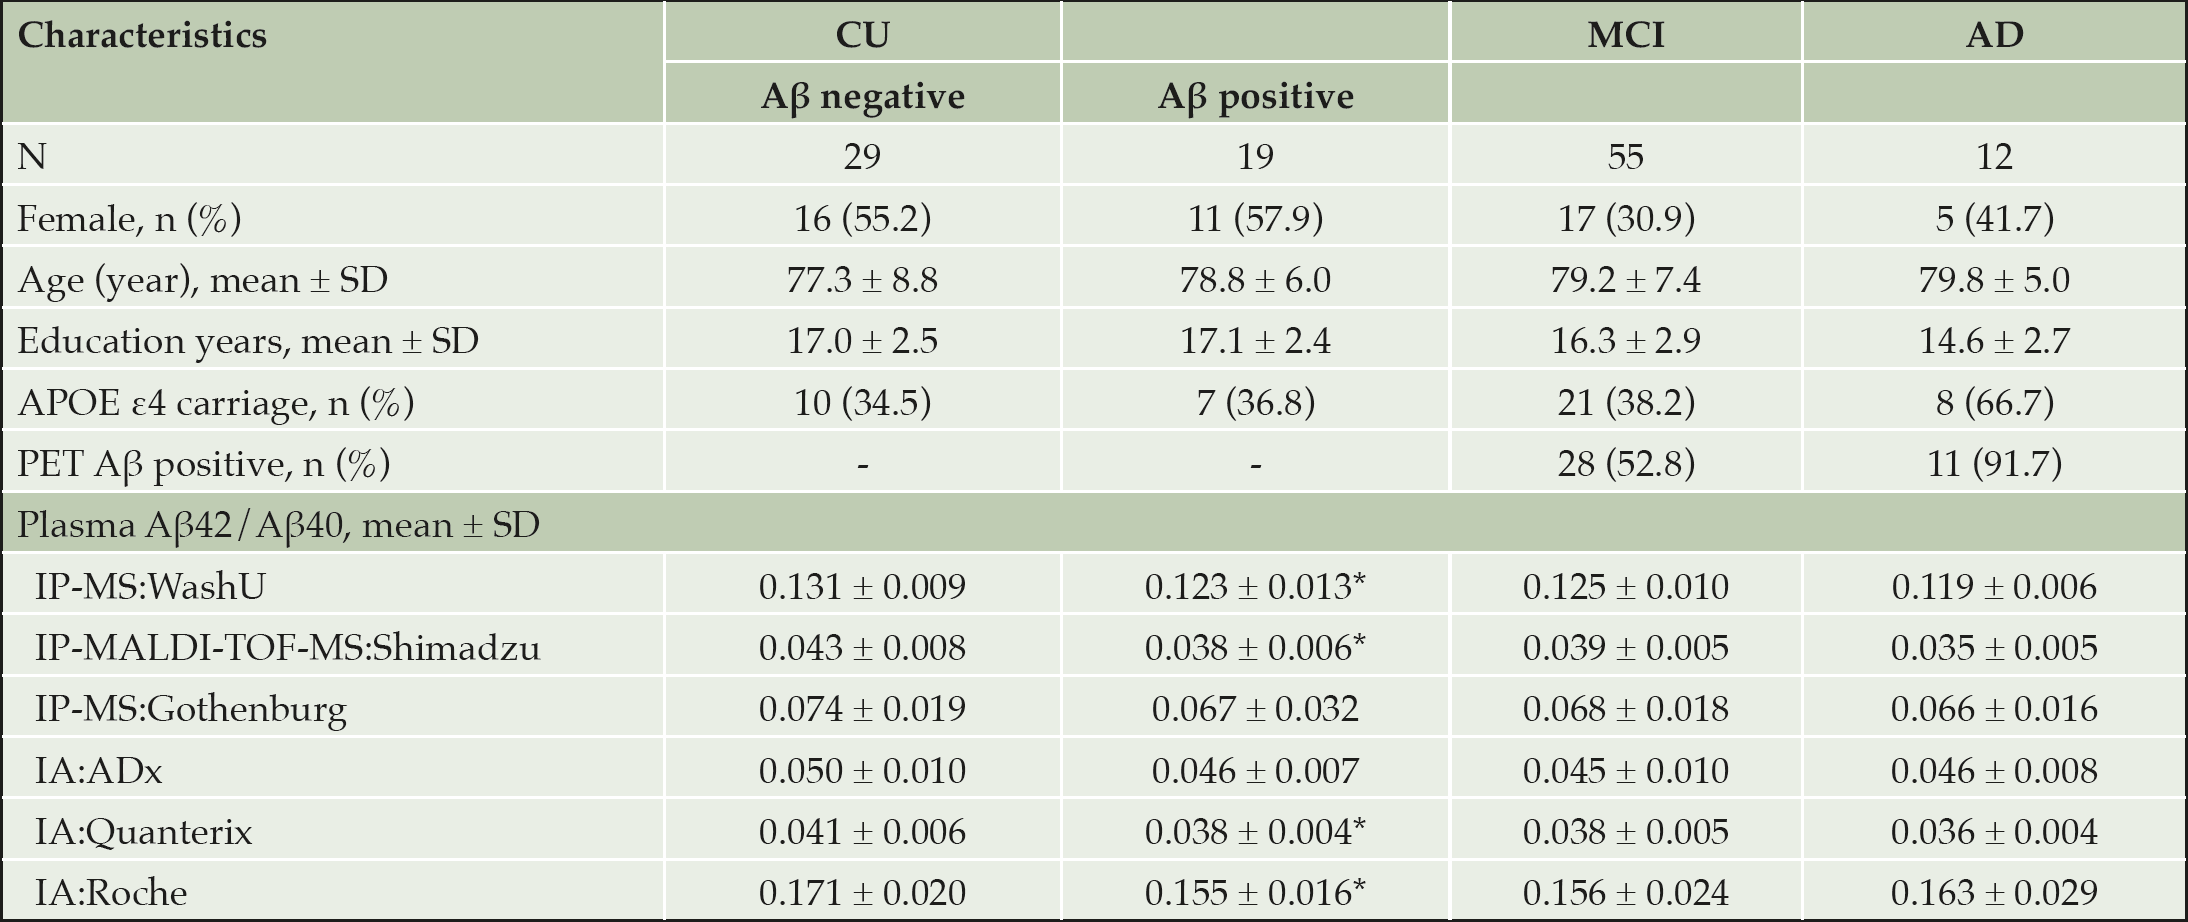
Table 1. Population characteristics
* P < 0.05 based on independent samples t test by Aβ-PET status.
Discrimination of Aβ-PET status in cognitively unaffected individuals
The ROC curves of the six plasma Aβ42/Aβ40 measures for discriminating CU participants with positive vs negative Aβ-PET are shown in Figure 1. Discriminative utility was observed in the following: WashU had the highest AUC (0.753, 95% CI: 0.601-0.905; P = 0.003), followed by Roche (0.737, 95% CI: 0.597-0.877; P = 0.006), Shimadzu (0.695, 95% CI: 0.545-0.845; P = 0.023) and Quanterix (0.693, 95% CI: 0.540-0.847; P = 0.025). The optimal combination of sensitivity and specificity according to Youden index of the four assays with significant AUCs are presented in Table 2.
In comparison, the AUCs for discriminating Aβ-PET status in CU participants by age alone and a prediction score based on age and APOE ε4 were 0.554 (95% CI: 0.390-0.717; P > 0.05) and 0.562 (95% CI: 0.395-0.729; P > 0.05), respectively.
Supplemental analyses showed that the assays of WashU and Roche also had relatively high discriminative ability for Aβ-PET status among MCI participants, with the AUCs of 0.860 (95% CI: 0.761-0.959; P < 0.001) and 0.754 (95% CI: 0.616-0.892; P = 0.002), respectively (Supplementary Table 2).
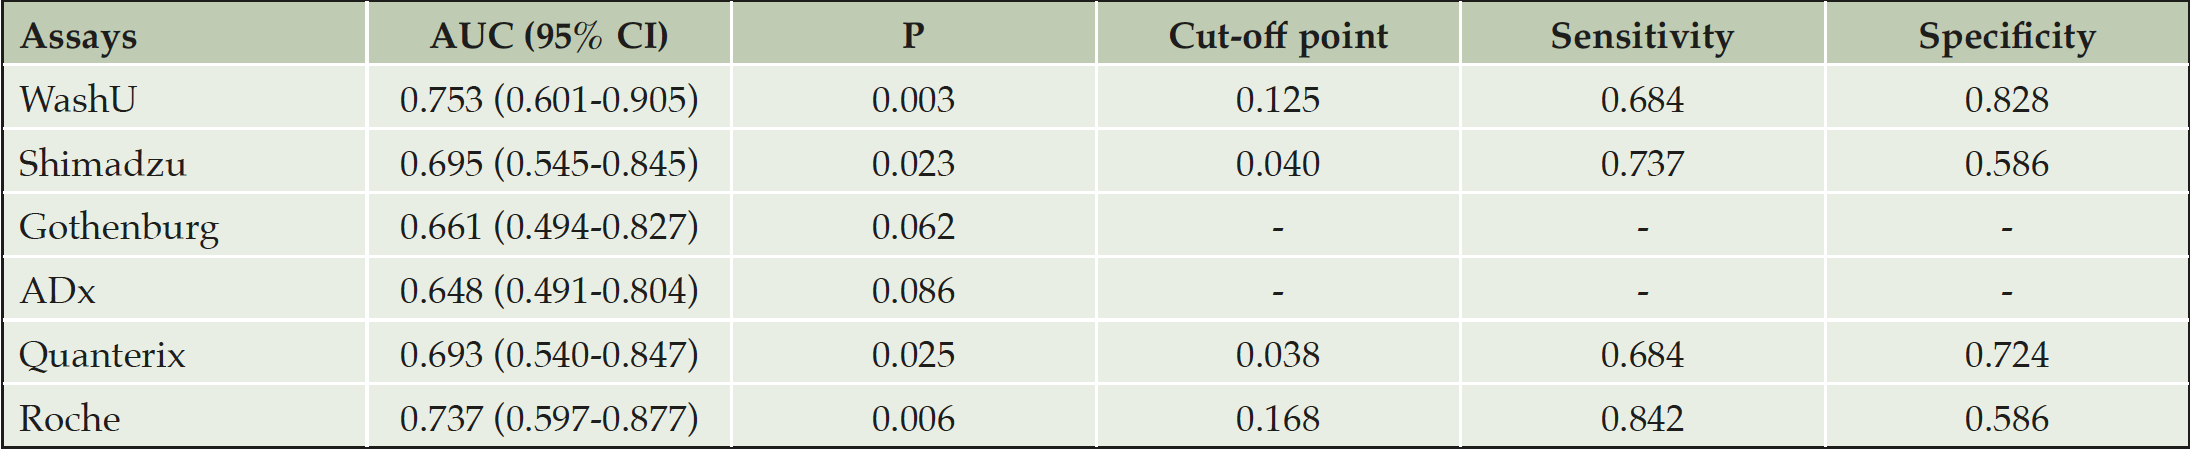
Table 2. Parameters of discriminative ability of six plasma Aβ42/Aβ40 measures for Aβ-PET status in cognitively unimpaired study participants
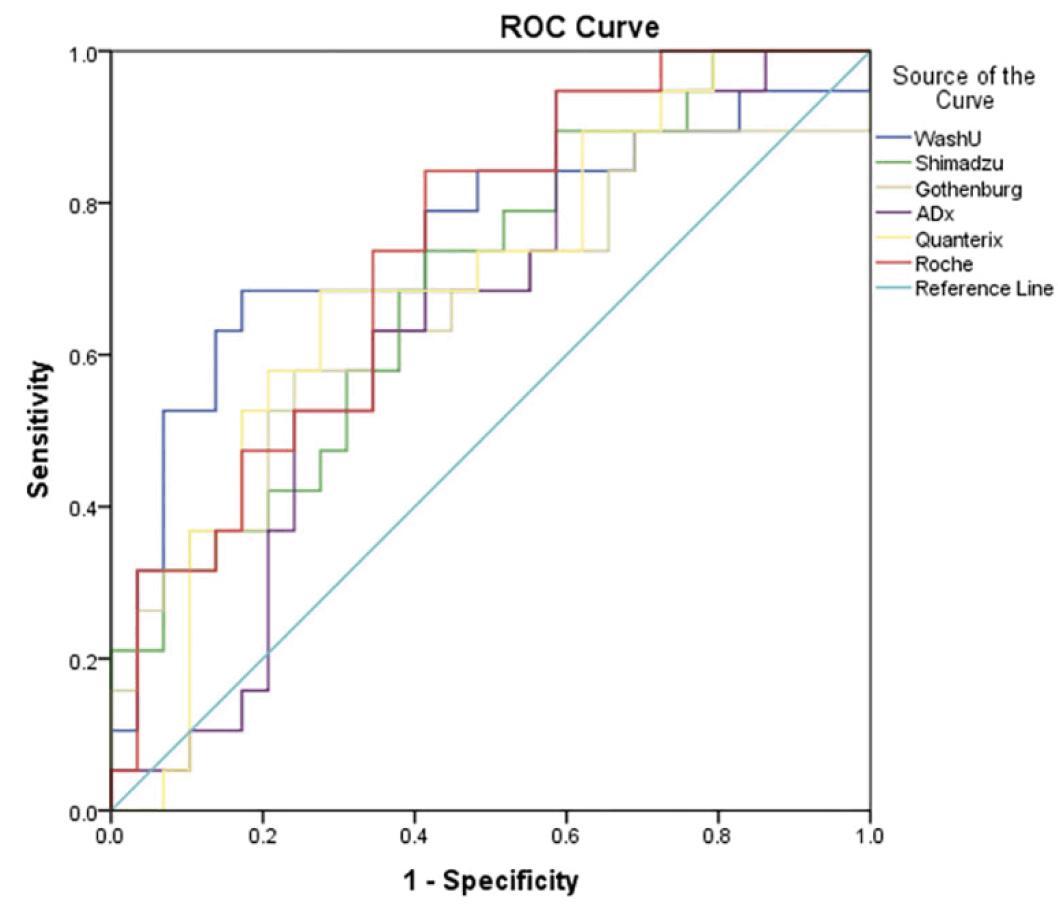
Figure 1. ROC curves of six plasma Aβ42/Aβ40 measures for discriminating Aβ-PET positive vs negative cognitively unimpaired participants
Discrimination of clinical diagnostic status
The ROC curves of the six plasma Aβ42/Aβ40 measures for discriminating AD cases vs CU participants are shown in Figure 2. Relatively high AUCs were observed for WashU (0.767, 95% CI: 0.644-0.891; P = 0.004), Quanterix (0.762, 95% CI: 0.620-0.905; P = 0.005) and Shimadzu (0.753, 95% CI: 0.610-0.897; P = 0.007); whereas the other three assays showed low diagnostic capacity (AUCs ranging from 0.538 to 0.583; P > 0.05).
In comparison, the AUCs for detecting AD cases by PET centiloid levels, age alone, and a prediction score based on age and APOE ε4 were 0.835 (95% CI: 0.676-0.994; P < 0.001), 0.592 (95% CI: 0.438-0.746; P = 0.327) and 0.734 (95% CI: 0.574-0.893; P = 0.013), respectively.
Similar results of the six plasma Aβ42/Aβ40 measures for discriminating AD cases vs the combination of CU and MCI participants are shown in Supplementary Table 3.
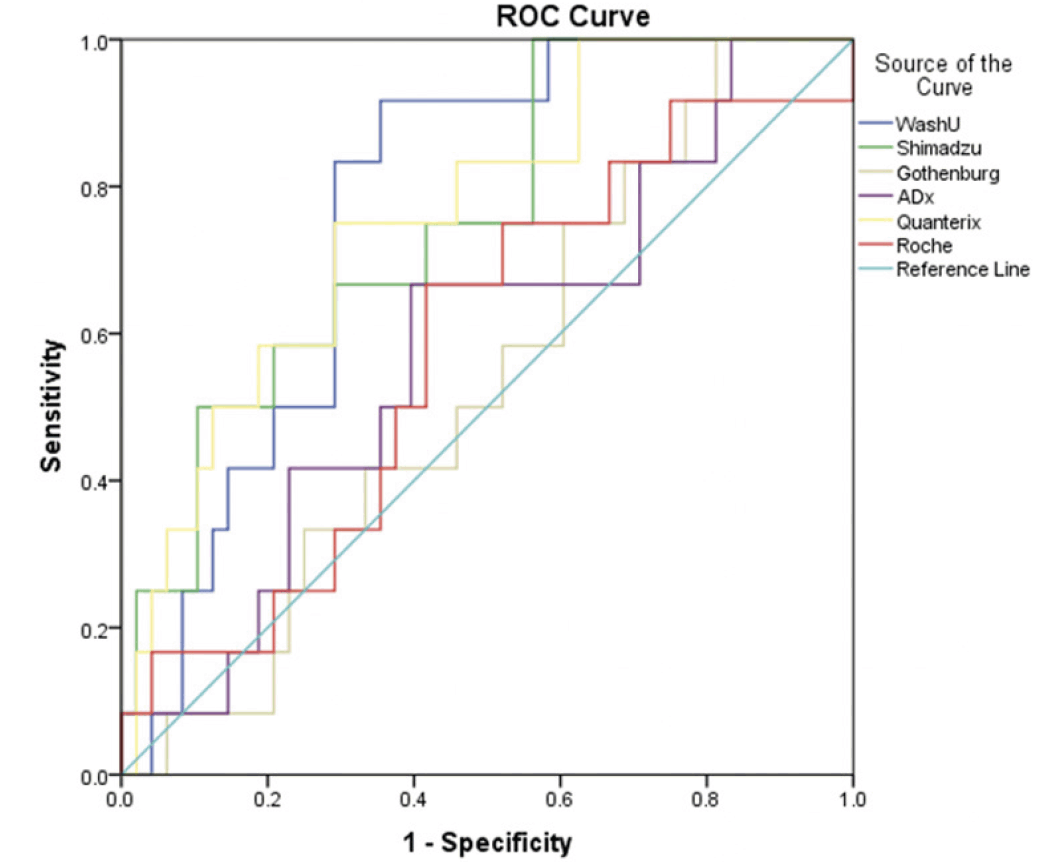
Figure 2. ROC curves of six plasma Aβ42/Aβ40 measures for discriminating AD cases vs CU individuals
Exploratory economic analysis of plasma Aβ42/Aβ40 for clinical trial recruitment and prevention programmes
A potential application of plasma Aβ42/Aβ40 assays is in screening for recruitment to clinical trials of disease-modifying therapies in the preclinical stage. In this setting, plasma assays can serve to pre-screen potential participants prior to PET scans, thus reducing the number of negative scans and the overall cost of recruitment. In addition, the assays may also have a role as a marker of disease progression and/or therapeutic response, post randomisation.
Table 3 presents a cost-minimisation analysis comparing the three diagnostic strategies, with the cut-off point for each assay optimised for lowest total screening cost. Actual prices for the plasma assays were not available, thus we used hypothetical values based on typical costs for IA and MS assays, respectively, while the cost for Aβ-PET was estimated to $2000. Due to the assumed difference in cost between the two plasma assays, the optimal balance of sensitivity/specificity differed, however the expected screening cost per recruited patient was very similar ($4115 and $4116, respectively). With the Roche immunoassay, 11.73 patients needed to be tested to identify one eligible patient, but in return 96.6% of PET scans are expected to be positive. At this level of specificity, it could be argued that the PET scan could be eliminated from the strategy altogether, further reducing the cost to $1525 per eligible patient.
In sensitivity analysis, 50% higher assay costs increased the total screening cost by less than 19% and did not alter the conclusions. Further, results were robust across different prevalence rates for amyloid positivity; at all prevalence rates below 65% plasma assays lowered screening costs compared to PET only (calculations not shown, available on request).
A second potential application for plasma assays is identifying amyloid-positive cognitively normal subjects for preventive programmes in the general population. In this setting, there is not only concern about the total cost of screening, but also with the risk of false negatives since this will cause amyloid-positive patients to be denied treatment (we assume that false positives are eliminated by confirmatory PET or other high-specificity investigation). Estimating the full cost of a false negative would require detailed data on the effect and cost of the disease modifying therapy, which is beyond the scope of this paper. However, we can calculate the cost of screening as a function of the sensitivity achieved, as illustrated in Figure 3 for the Roche and WashU assays. The WashU assay provides the lowest cost per screened patient at desired sensitivity values between approximately 35% and 70%, while the Roche assay gives the lowest cost outside this range.
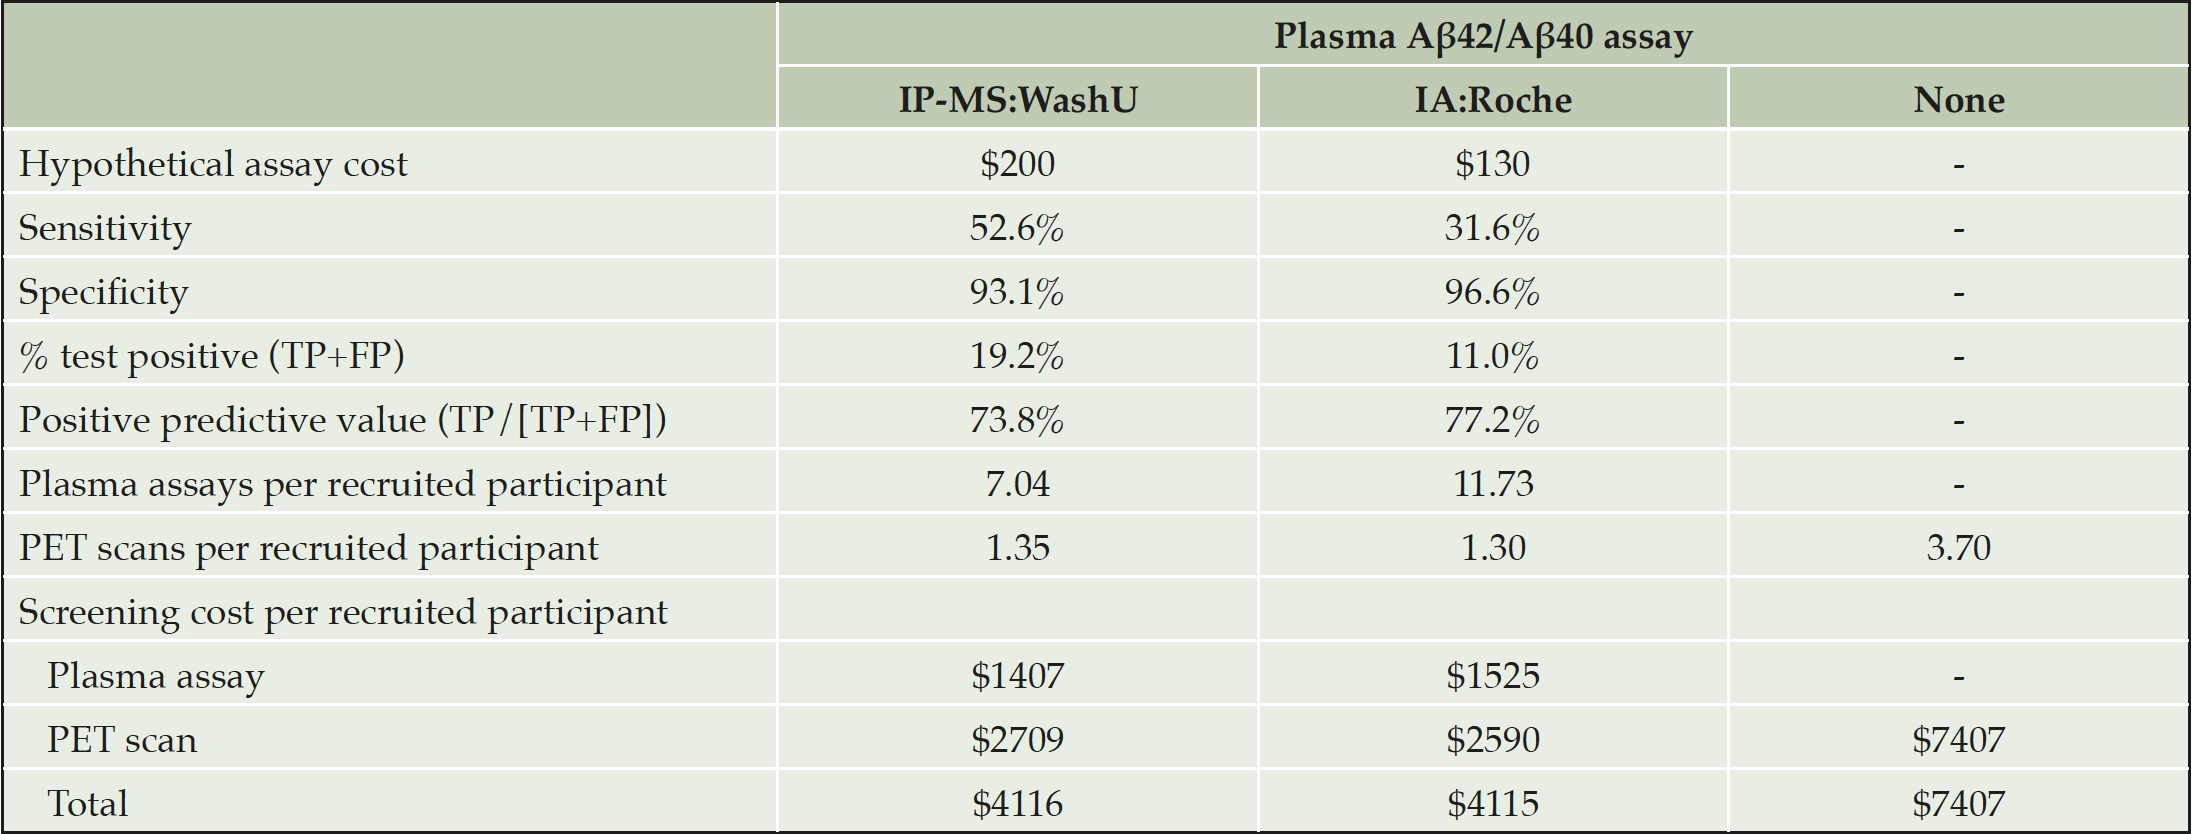
Table 3. Explorative economic analysis for clinical trial recruitment
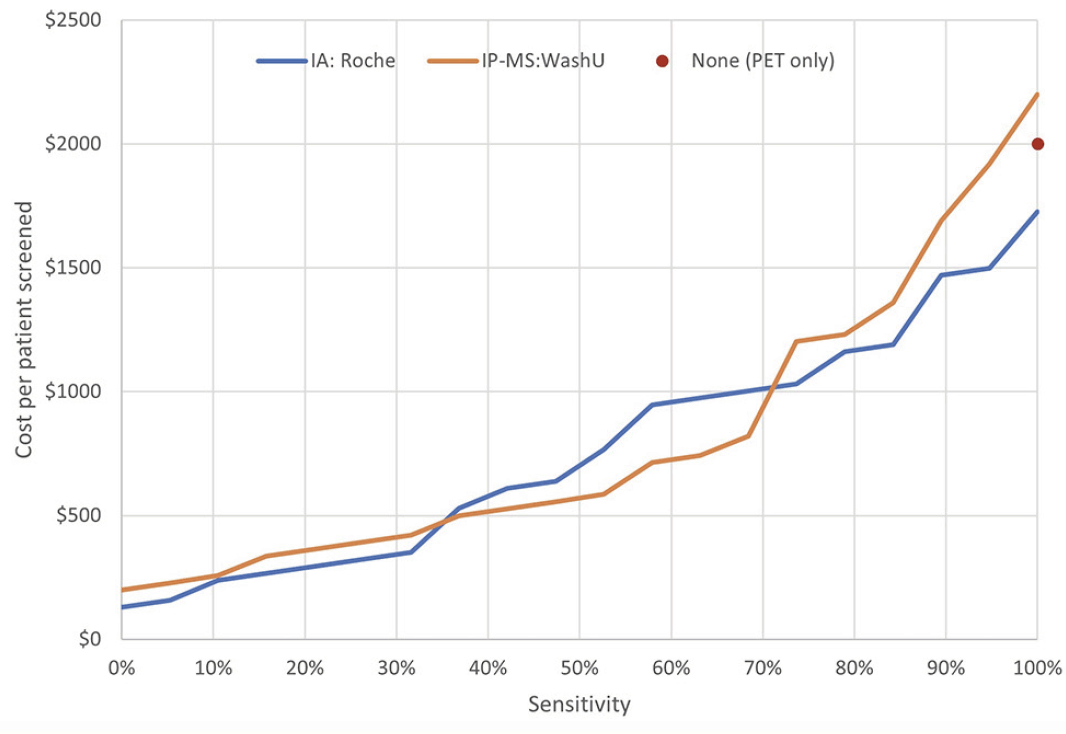
Figure 3. Schematic of hypothesised per-participant cost for IA:Roche, IP-MS:WashU and PET only in population-based prevention programmes
Discussion
Non-invasive biomarkers enabling Alzheimer precision medicine is a highly prioritised task, due to the perceived invasiveness and/or high costs of the currently utilised PET and CSF measures. Further, the potential presence of significant AD heterogeneity indicates a need for diversity in the toolbox of markers. Finding target populations for preventive measures is challenging since prevention, by its very nature, is most efficiently-targeted at the actual disease onset. The markers thus must be not only precise but also of sufficient levels and present within the right timeframe (2, 24). A biomarker-based definition of risk-for AD status in cognitively healthy older adults would truly represent a cornerstone both for population-based public health prevention strategies and for AD prevention clinical trials. For the latter, cost-effective biomarkers would serve several key aspects: 1) predictive value accuracy for amyloid pathology to aid patient selection for the more invasive/expensive PET and/or CSF studies, and 2) frequent treatment response monitoring in anti-amyloid or anti-tau therapies, over time.
Diagnostic utility of plasma Aβ42/Aβ40 for amyloid status determination in AD prevention trials
Accumulating evidence from exploratory and validation studies suggests that plasma amyloid biomarkers, especially the Aβ42/Aβ40 ratio, have high potential to fulfil this need. Though multiple studies have provided information on the diagnostic accuracy, predictive capacity and possible clinical utility of this marker in trials involving MCI and AD patients, very few have focused on examining these characteristics in cognitively unimpaired individuals. Even fewer studies have evaluated cost-implications for utility of plasma Aβ42/Aβ40 ratio as a pre-screening biomarker in AD prevention trials. In this study, we used the recently reported ADNI data to evaluate the discriminative capacity and diagnostic accuracy of plasma Aβ42/Aβ40 ratio, measured using distinct platforms (immuno-assay based: IA:Roche, IA:ADx, and IA:Quanterix; and MS based: IP-MS:WashU, IP-MALDI-TOF-MS:Shimadzu, IP-MS:Gothenburg) for determining AD and brain amyloid PET status. We further compared the cost-effectiveness of IA-based versus MS-based plasma amyloid platforms i.e. IP-MS:WashU versus IA:Roche as possible pre-screening tools for pre-selection of individuals for brain amyloid PET evaluation in AD prevention trials.
Plasma Aβ42/Aβ40 levels have been shown to be considerably lower in AD patients compared to controls (7) and also found to decline, over time, in CU individuals who were amyloid PET-positive at baseline (14). We found significantly lower plasma Aβ42/Aβ40 in amyloid PET-positive CU study participants with two MS based (IP-MS:WashU and IP-MALDI-TOF-MS:Shimadzu) and two IA (IA:Quanterix and IA:Roche) platforms. These results corroborate findings from other studies that have reported lower plasma Aβ42/Aβ40 in PET-positive cognitively normal older adults using MS based (11) and IA assays (6). Compared to CSF, where Aβ42/Aβ40 ratio difference between PET-positive to negative could be up to 50% (25), the differences seen with the plasma levels are quite small (7-12%). Our results corroborate data reported by Janelidze et al 2016, that sought to assess the clinical utility of plasma Aβ42/Aβ40 ratio measured using the ultrasensitive SIMOA IA by Quanterix (7). Using data from participants across the AD clinical continuum: CU, MCI and AD enrolled in the Swedish BioFINDER study, they reported an inverse association for plasma Aβ and brain PET amyloid, with lower plasma levels in AD patients. Importantly they noted that levels were only moderately decreased at earlier disease stages, suggesting that overt Aβ changes in the periphery occur at a later stage in the disease trajectory (7). This may explain the differences in magnitude of changes between plasma Aβ and CSF, though does not argue against the use of plasma Aβ in preclinical populations. Indeed, more recent analysis of longitudinal data from the AIBL study reported early changes in plasma Aβ42/Aβ40 ratio that mirrored that of PET-detected brain amyloid changes (7.9% and 8.8% respectively). Interestingly their evaluation of the longitudinal trajectory of plasma Aβ compared to brain Aβ revealed changes in plasma preceding that of brain Aβ, by a median of six years (6). Their findings suggest, contrary to the previous report of Janelidze et al, that Aβ changes are evident earlier in peripheral biofluids. It is important to note that the AIBL study sample featured cognitively unimpaired subjects whilst the Swedish Biofinder cohort included participants with diverse AD diagnostic status. Though posited as potentially useful for clinical trial monitoring, future work is required to assess plasma Aβ trajectories in relation to progression from the preclinical AD stage.
The relatively small difference in plasma Aβ42/Aβ40 levels for PET positive and negative cognitively unimpaired subjects may contribute to the inconsistent results noted across the different platforms assessed in this study. Methodological differences may further explain the observed disparities, including pre-analytical inconsistencies across labs and centres (26). Verberk et al in an unbiased evidence-based evaluation of pre-analytic methods for blood AD markers observed significant differences in blood Aβ recovery, impacted by variation in collection tube-type as well as time factors affecting centrifugation and storage processes (27). Other sources of variation may arise from the distinct sensitivities of the different assays for measuring plasma Aβ or instability due to multiple freeze-thaw cycles (26, 28-31). On the other hand, recent developments in this field including fully automated technologies and multiplexing of 40 and 42 assays, may mitigate such variations (26). Further global adoption of standardised pre-analytic protocols to harmonise sample collection, processing and storage processes for latent measurement of AD biomarkers could minimise variability of results.
In our analyses all assays evaluated for the measurement of plasma Aβ42/Aβ40 showed significant correlations with PET centiloid values (r range = -0.517 – -0.241), with highest correlation noted for IP-MS:WashU (Supplementary Figure 2). Furthermore, this MS-based assay showed best diagnostic performance for determining amyloid PET positivity-status in cognitively unimpaired subjects, even more accurately than notable risk factors: age and APOE combined, with the IA:Roche assay coming a close second (AUC IP-MS:WashU = 0.753, P = 0.003; AUC IA:Roche = 0.737, P = 0.006; AUC age/APOE = 0.562, P > 0.05) (see Figure 1 and Table 2). These results from our focused evaluation of cognitively unimpaired individuals support those of Chatterjee et al, 2019 who reported an AUC of 0.78 for detection of PET positivity in CU older adults, using a SIMOA-based assay for measurement of plasma Aβ42/Aβ40 (13). Our findings further extend on the report from Janelidze et al, who also noted IP-MS:WashU as having the highest accuracy for detecting abnormal brain Aβ status (AUC WashU = 0.85), albeit in a mixed population of CU, MCI and AD patients from the same ADNI study (8).
Our explorative economic evaluation indicates considerable potential cost-savings in trial recruitment through the use of plasma Aβ assays, the total screening cost could be reduced by up to $5882 per recruited patient (-79%) through substitution of PET with a highly specific assay. It should be noted these are simplified estimates and do not account for e.g. the cost of inviting participants and obtaining informed consent (though these costs should be limited as initial inclusion criteria can be wide).
Clinical utility of plasma Aβ42/Aβ40 in the clinic and in population-based AD preventive strategies
Assessment of the discriminative ability for the plasma Aβ42/Aβ40 ratio measured across the investigated platforms for distinguishing AD cases from CN further revealed the IP-MS:WashU as having the numerically highest AUC (0.767). The IA, Quanterix also had a high AUC (0.762), and with the other IP-MS assay, Shimadzu (AUC = 0.753) exceeded performance of the age and APOE-combined model (AUC = 0.734). Few studies have evaluated the potential clinical utility of plasma Aβ42/Aβ40 ratio for detecting clinical AD cases. A previous study by Feinkohl et al in 2020 found that plasma Aβ42/Aβ40 ratio did not significantly distinguish biomarker positive (A+N+) AD patients from biomarker negative (A-N-) healthy controls. (AUC = 0.58; 95% CI: 0.46-0.70) (15). The result disparity may be explained by methodological differences as their study used a standard ELISA for measurement of plasma Aβ42 and 40. Our findings support those of Thijssen et al, who reported a good clinical competence of the plasma Aβ42/Aβ40 ratio for discriminating AD from controls, using a novel optimised IA, “Amyblood”, developed for detection of full length Aβ42 and Aβ40 with SIMOA technology, thus leveraging highly specific antibodies coupled with the ultrasensitive SIMOA platform (20).
Plasma Aβ assays may also enable cost-effective deployment of general-population prevention programmes. Avoiding false-positives will be a high priority for this type of program, thus a highly specific confirmatory diagnostic test will likely be required. Scaling PET capacity to meet the demand of such programs will be very challenging, underscoring the need for adequate pre-screening as well as alternatives such as CSF-based assays. Pre-screening with a plasma Aβ assays can achieve a sensitivity of 50% at a cost of approximately $570 per screened patient including the cost of confirmatory PET. This cost will need to be brought down to allow large-scale deployment; this could be achieved through combination with other risk markers and risk scores, such as polygenic or lifestyle-based risk scores, such as CAIDE (32).
Limitations
The results reported in this study must be interpreted with caution. The sample population evaluated in this study were pre-selected based on equivalent numbers for brain amyloid PET positive and negative (~50% in each group), thus non-generalisable to typical population where the age-dependent prevalence of amyloid positivity in pre-symptomatic older adults (age 50-90 years) was estimated at 24.4% for PET and 26.5% for CSF (23). Furthermore, though strengthened by inclusion of the well-characterised ADNI CU participants, all of whom had available information on plasma Aβ measured using the different platforms investigated and associated clinical information, as well as brain amyloid PET, the sample size of CU is relatively small (n = 48). Further studies are encouraged in well-characterised high-powered pre-clinical longitudinal cohorts to fully estimate the diagnostic accuracy and clinical utility of the distinct platforms for measuring plasma Aβ, and develop cut-offs, including peri-threshold values previously shown to be associated with pathology accumulation (33) and cognitive decline (34).
Notwithstanding, since a majority of Aβ in plasma arises from the main CNS-pathological hallmark in AD reflected by PIB-PET amyloid plaques and CSF-Aβ (25, 35), this less invasive test has a clear advantage by reliably predicting brain amyloid burden. Of note, the phosphorylated isoforms of tau protein pTau181 (36, 37) and pTau217 (38) have also shown promising specificity for predicting both CSF Aβ positivity and longitudinal AD progression, though when compared with the plasma Aβ platforms presented in this study, plasma Aβ outperforms pTau in detecting Aβ-positivity in cognitively unimpaired individuals (11). Furthermore, recent evidence for plasma neurofilament light (NFL), a neurodegeneration biomarker, revealed high capacity in predicting cognitive decline from MCI, but not from the preclinical AD stages (39).
From a prevention focused precision medicine perspective, generating risk profiles rather than dichotomous classifications and thresholds of single markers could increase the ability to customise interventions (for example, see (40)). In this context, the GWAS-derived polygenic risk score (PRS) not only shows promising accuracy for AD prediction but may also provide new biological insight, including associations between pathway specific PRS and AD phenotypes which may enable better-tailored treatment strategies. In the International Genomics of Alzheimer’s Project (IGAP) GWAS dataset, PRS alone had an AUC of 75%, increasing to 78% upon inclusion of age and sex in the model, for AD prediction (41). In the ADNI cohort PRS (excluding APOE) had a prediction AUC of 0.75 for AD status, that increased to 0.82 when including APOE (42). Further, PRS in autopsy confirmed AD cases had a predictive AUC of 0.84 (43). The advantages of PRS also includes the capability of predicting the risk of multiple other diseases which can be monitored and, perhaps even prevented simultaneously, through lifestyle intervention strategies (44, 45). It should however be noted that genes and their expression patterns do not always correlate with protein levels (reviewed in (46)) and genetic profiles are not limited by temporal factors such as post-translational protein modifications, diurnal variation, biomarker half-life etc. On the other hand, since proteins are the main active components in cellular signaling pathways, proteomic approaches are important complements to understand disorders of multifactorial etiologies, such as AD. There are multiple proteomic platforms allowing both broad and deep plasma phenotyping (see (47) for review). However, for implementation across pre-screening and outcome monitoring in AD prevention trials e.g. featuring anti-amyloid therapeutics, a single molecule test that requires less data processing would likely be more optimal than -omics, emphasising the importance of conducting and combining different types of biomarker analyses in well characterised clinical cohorts.
Conclusions
Cognitively healthy at-risk-for-AD older adults are the optimal target group for dementia prevention, thus pre-screening tests need to be both cost efficient and precise for including subjects that would benefit from prevention programs. We have shown in this study that for cognitively unimpaired subjects, plasma Aβ42/Aβ40 ratio measured using the MS-based platform – IP-MS:WashU showed highest diagnostic accuracy for detecting amyloid PET-positive status, with similar effectiveness noted for the IA-based platform – Roche. IP-MS:WashU, Shimadzu and IA:Quanterix also performed best in discriminating AD from pre-dementia cases. The IA and MS-based tests are cost-effective and easy to implement as amyloid positivity pre-screening tool for inclusion in AD prevention clinical trials, and as part of routine care diagnostic workup in identifying at-risk individuals with high brain amyloid burden, for preventive therapies. Though these newly-developed ultra-sensitive and specialised plasma Aβ assays show highly promising diagnostic capacity in preclinical AD, further evaluation of diagnostic competency in preclinical population-based samples and standardisation of pre-analytic methods are required to support applicability for wider clinical use. Nonetheless targeted plasma amyloid screening tools, as described here, could be clinically useful for trials investigating anti-amyloid agents, both for participant selection and, post randomisation for frequent response monitoring, including evolution of amyloid pathology over time, alongside tracking disease progression. Further, given the recent advances in cost-effective technologies for measuring AD biomarkers, plasma Aβ42/Aβ40 ratio could form an integral part of a plasma-based AT[N] diagnostic toolkit, alongside plasma pTau and NFL, promoting biomarker-access and brain health equity, especially in communities with limited to no access to expensive modalities, such as PET, for detecting AD neuropathology. Coupled with broader approaches such as PRS and other -omics strategies, this biomarker could be useful for AD risk ascertainment in preventative population-based – public health strategies.
Funding: Data collection and sharing for this project was funded by the Alzheimer’s Disease Neuroimaging Initiative (ADNI) (National Institutes of Health Grant U01 AG024904) and DOD ADNI (Department of Defense award number W81XWH-12-2-0012). ADNI is funded by the National Institute on Aging, the National Institute of Biomedical Imaging and Bioengineering, and through generous contributions from the following: AbbVie, Alzheimer’s Association; Alzheimer’s Drug Discovery Foundation; Araclon Biotech; BioClinica, Inc.; Biogen; Bristol-Myers Squibb Company; CereSpir, Inc.; Cogstate; Eisai Inc.; Elan Pharmaceuticals, Inc.; Eli Lilly and Company; EuroImmun; F. Hoffmann-La Roche Ltd and its affiliated company Genentech, Inc.; Fujirebio; GE Healthcare; IXICO Ltd.; Janssen Alzheimer Immunotherapy Research & Development, LLC.; Johnson & Johnson Pharmaceutical Research & Development LLC.; Lumosity; Lundbeck; Merck & Co., Inc.; Meso Scale Diagnostics, LLC.; NeuroRx Research; Neurotrack Technologies; Novartis Pharmaceuticals Corporation; Pfizer Inc.; Piramal Imaging; Servier; Takeda Pharmaceutical Company; and Transition Therapeutics. The Canadian Institutes of Health Research is providing funds to support ADNI clinical sites in Canada. Private sector contributions are facilitated by the Foundation for the National Institutes of Health (www.fnih.org). The grantee organization is the Northern California Institute for Research and Education, and the study is coordinated by the Alzheimer’s Therapeutic Research Institute at the University of Southern California. ADNI data are disseminated by the Laboratory for Neuro Imaging at the University of Southern California. The sponsors had no role in the design and conduct of the study; in the collection, analysis, and interpretation of data; in the preparation of the manuscript; or in the review or approval of the manuscript.
Acknowledgment: We would like to thank Prof. Anders Wimo (Karolinska Institutet), Dr. Susan Baker (Janssen Research & Development) and Dr. David Scott (Bioclinica) for their intellectual contributions to the manuscript.
Conflict of Interest Disclosure: Prof. Lefkos Middleton has received research funding (to Institution) from Janssen , Merck (USA), Gates, Takeda/ Millenium, Novartis, EIT Health, and Invincro, outside the submitted work. Prof. Miia Kivipelto has served as speaker for Biogen, Nutricia, Nestle and Lundbeck, has served in advisory boards of Biogen, Combinostics, Swedish Care International and Roche, and has received grants from Academy of Finland, Swedish Research Council, JPND, EU 7th framework, CIMED, IMI, Wallenberg Clinical grant, FORTE, KI-Janssen Strategic Collaboration, Imperial College ITMAT, Gates Ventures/ADDI, Alzheimer’s Drug Discovery Foundation and Part the Cloud, outside the submitted work. Dr. Linus Jönsson receives personal fees from H. Lundbeck, outside the submitted work. All other authors declare no conflict of interest.
Ethical standard: Ethical approval was given by the local ethical committees of all involved sites of ADNI, and the research was conducted in accordance with the Helsinki Declaration.
Open Access: This article is distributed under the terms of the Creative Commons Attribution 4.0 International License (http://creativecommons.org/licenses/by/4.0/), which permits use, duplication, adaptation, distribution and reproduction in any medium or format, as long as you give appropriate credit to the original author(s) and the source, provide a link to the Creative Commons license and indicate if changes were made.
References
1. Vellas B, Aisen P. New Hope for Alzheimer’s Disease. J Prev Alzheimers Dis. 2021;8(3):238-239. doi:10.14283/jpad.2021.26
2. Cummings J, Feldman HH, Scheltens P. The “rights” of precision drug development for Alzheimer’s disease. Alzheimers Res Ther. 2019;11(1):76. doi:10.1186/s13195-019-0529-5
3. Jack CR, Jr., Bennett DA, Blennow K, et al. NIA-AA Research Framework: Toward a biological definition of Alzheimer’s disease. Alzheimers Dement. 2018;14(4):535-562. doi:10.1016/j.jalz.2018.02.018
4. Fagan AM, Roe CM, Xiong C, Mintun MA, Morris JC, Holtzman DM. Cerebrospinal fluid tau/beta-amyloid(42) ratio as a prediction of cognitive decline in nondemented older adults. Arch Neurol. 2007;64(3):343-349. doi:10.1001/archneur.64.3.noc60123
5. Villain N, Chetelat G, Grassiot B, et al. Regional dynamics of amyloid-beta deposition in healthy elderly, mild cognitive impairment and Alzheimer’s disease: a voxelwise PiB-PET longitudinal study. Brain. 2012;135(Pt 7):2126-2139. doi:10.1093/brain/aws125
6. Burnham SC, Fandos N, Fowler C, et al. Longitudinal evaluation of the natural history of amyloid-beta in plasma and brain. Brain Commun. 2020;2(1):fcaa041. doi:10.1093/braincomms/fcaa041
7. Janelidze S, Stomrud E, Palmqvist S, et al. Plasma beta-amyloid in Alzheimer’s disease and vascular disease. Sci Rep. 2016;6:26801. doi:10.1038/srep26801
8. Janelidze S, Teunissen CE, Zetterberg H, et al. Head-to-Head Comparison of 8 Plasma Amyloid-beta 42/40 Assays in Alzheimer Disease. JAMA Neurol. 2021. doi:10.1001/jamaneurol.2021.3180
9. Lui JK, Laws SM, Li QX, et al. Plasma amyloid-beta as a biomarker in Alzheimer’s disease: the AIBL study of aging. J Alzheimers Dis. 2010;20(4):1233-1242. doi:10.3233/JAD-2010-090249
10. Nakamura A, Kaneko N, Villemagne VL, et al. High performance plasma amyloid-beta biomarkers for Alzheimer’s disease. Nature. 2018;554(7691):249-254. doi:10.1038/nature25456
11. Tosun D, Veitch D, Aisen P, et al. Detection of beta-amyloid positivity in Alzheimer’s Disease Neuroimaging Initiative participants with demographics, cognition, MRI and plasma biomarkers. Brain Commun. 2021;3(2):fcab008. doi:10.1093/braincomms/fcab008
12. Lin SY, Lin KJ, Lin PC, et al. Plasma amyloid assay as a pre-screening tool for amyloid positron emission tomography imaging in early stage Alzheimer’s disease. Alzheimers Res Ther. 2019;11(1):111. doi:10.1186/s13195-019-0566-0
13. Chatterjee P, Elmi M, Goozee K, et al. Ultrasensitive Detection of Plasma Amyloid-beta as a Biomarker for Cognitively Normal Elderly Individuals at Risk of Alzheimer’s Disease. J Alzheimers Dis. 2019;71(3):775-783. doi:10.3233/JAD-190533
14. Doecke JD, Perez-Grijalba V, Fandos N, et al. Total Abeta42/Abeta40 ratio in plasma predicts amyloid-PET status, independent of clinical AD diagnosis. Neurology. 2020;94(15):e1580-e1591. doi:10.1212/WNL.0000000000009240
15. Feinkohl I, Schipke CG, Kruppa J, et al. Plasma Amyloid Concentration in Alzheimer’s Disease: Performance of a High-Throughput Amyloid Assay in Distinguishing Alzheimer’s Disease Cases from Controls. J Alzheimers Dis. 2020;74(4):1285-1294. doi:10.3233/JAD-200046
16. Perez-Grijalba V, Arbizu J, Romero J, et al. Plasma Abeta42/40 ratio alone or combined with FDG-PET can accurately predict amyloid-PET positivity: a cross-sectional analysis from the AB255 Study. Alzheimers Res Ther. 2019;11(1):96. doi:10.1186/s13195-019-0549-1
17. Giudici KV, de Souto Barreto P, Guyonnet S, et al. Assessment of Plasma Amyloid-beta42/40 and Cognitive Decline Among Community-Dwelling Older Adults. JAMA Netw Open. 2020;3(12):e2028634. doi:10.1001/jamanetworkopen.2020.28634
18. Stockmann J, Verberk IMW, Timmesfeld N, et al. Correction to: Amyloid-beta misfolding as a plasma biomarker indicates risk for future clinical Alzheimer’s disease in individuals with subjective cognitive decline. Alzheimers Res Ther. 2021;13(1):25. doi:10.1186/s13195-021-00770-2
19. Schindler SE, Bollinger JG, Ovod V, et al. High-precision plasma beta-amyloid 42/40 predicts current and future brain amyloidosis. Neurology. 2019;93(17):e1647-e1659. doi:10.1212/WNL.0000000000008081
20. Thijssen EH, Verberk IMW, Vanbrabant J, et al. Highly specific and ultrasensitive plasma test detects Abeta(1-42) and Abeta(1-40) in Alzheimer’s disease. Sci Rep. 2021;11(1):9736. doi:10.1038/s41598-021-89004-x
21. Weiner MW, Veitch DP, Aisen PS, et al. The Alzheimer’s Disease Neuroimaging Initiative 3: Continued innovation for clinical trial improvement. Alzheimers Dement. 2017;13(5):561-571. doi:10.1016/j.jalz.2016.10.006
22. Knopman DS, Lundt ES, Therneau TM, et al. Association of Initial beta-Amyloid Levels With Subsequent Flortaucipir Positron Emission Tomography Changes in Persons Without Cognitive Impairment. JAMA Neurol. 2021;78(2):217-228. doi:10.1001/jamaneurol.2020.3921
23. Jansen WJ, Ossenkoppele R, Knol DL, et al. Prevalence of cerebral amyloid pathology in persons without dementia: a meta-analysis. JAMA. 2015;313(19):1924-1938. doi:10.1001/jama.2015.4668
24. Mayeux R. Biomarkers: potential uses and limitations. NeuroRx. 2004;1(2):182-188. doi:10.1602/neurorx.1.2.182
25. Ovod V, Ramsey KN, Mawuenyega KG, et al. Amyloid beta concentrations and stable isotope labeling kinetics of human plasma specific to central nervous system amyloidosis. Alzheimers Dement. 2017;13(8):841-849. doi:10.1016/j.jalz.2017.06.2266
26. O’Bryant SE, Gupta V, Henriksen K, et al. Guidelines for the standardization of preanalytic variables for blood-based biomarker studies in Alzheimer’s disease research. Alzheimers Dement. 2015;11(5):549-560. doi:10.1016/j.jalz.2014.08.099
27. Verberk IM, Misdorp EO, Koelewijn JM, et al. A biorepository for the in-depth validation of pre-analytical sample handling effects on novel blood-based biomarkers for Alzheimer’s disease: The first results. Alzheimers and Dementia. 2020;16:e045763. doi:10.1002/alz.045763
28. Ashton NJ, Suarez-Calvet M, Karikari TK, et al. Effects of pre-analytical procedures on blood biomarkers for Alzheimer’s pathophysiology, glial activation, and neurodegeneration. Alzheimers Dement (Amst). 2021;13(1):e12168. doi:10.1002/dad2.12168
29. Lachno DR, Vanderstichele H, De Groote G, et al. The influence of matrix type, diurnal rhythm and sample collection and processing on the measurement of plasma beta-amyloid isoforms using the INNO-BIA plasma Abeta forms multiplex assay. J Nutr Health Aging. 2009;13(3):220-225. doi:10.1007/s12603-009-0062-5
30. Rozga M, Bittner T, Batrla R, Karl J. Preanalytical sample handling recommendations for Alzheimer’s disease plasma biomarkers. Alzheimers Dement (Amst). 2019;11:291-300. doi:10.1016/j.dadm.2019.02.002
31. Keshavan A, Heslegrave A, Zetterberg H, Schott JM. Stability of blood-based biomarkers of Alzheimer’s disease over multiple freeze-thaw cycles. Alzheimers Dement (Amst). 2018;10:448-451. doi:10.1016/j.dadm.2018.06.001
32. Kivipelto M, Ngandu T, Laatikainen T, Winblad B, Soininen H, Tuomilehto J. Risk score for the prediction of dementia risk in 20 years among middle aged people: a longitudinal, population-based study. Lancet Neurol. 2006;5(9):735-741. doi:10.1016/S1474-4422(06)70537-3
33. Landau SM, Horng A, Jagust WJ, Alzheimer’s Disease Neuroimaging Initiative. Memory decline accompanies subthreshold amyloid accumulation. Neurology. 2018;90(17):e1452-e1460. doi:10.1212/WNL.0000000000005354
34. McRae-McKee K, Udeh-Momoh CT, Price G, et al. Perspective: Clinical relevance of the dichotomous classification of Alzheimer’s disease biomarkers: Should there be a “gray zone”? Alzheimers Dement. 2019;15(10):1348-1356. doi:10.1016/j.jalz.2019.07.010
35. Roberts KF, Elbert DL, Kasten TP, et al. Amyloid-beta efflux from the central nervous system into the plasma. Ann Neurol. 2014;76(6):837-844. doi:10.1002/ana.24270
36. Mielke MM, Hagen CE, Xu J, et al. Plasma phospho-tau181 increases with Alzheimer’s disease clinical severity and is associated with tau- and amyloid-positron emission tomography. Alzheimers Dement. 2018;14(8):989-997. doi:10.1016/j.jalz.2018.02.013
37. Karikari TK, Pascoal TA, Ashton NJ, et al. Blood phosphorylated tau 181 as a biomarker for Alzheimer’s disease: a diagnostic performance and prediction modelling study using data from four prospective cohorts. Lancet Neurol. 2020;19(5):422-433. doi:10.1016/S1474-4422(20)30071-5
38. Palmqvist S, Janelidze S, Quiroz YT, et al. Discriminative Accuracy of Plasma Phospho-tau217 for Alzheimer Disease vs Other Neurodegenerative Disorders. JAMA. 2020;324(8):772-781. doi:10.1001/jama.2020.12134
39. He L, de Souto Barreto P, Aggarwal G, et al. Plasma Abeta and neurofilament light chain are associated with cognitive and physical function decline in non-dementia older adults. Alzheimers Res Ther. 2020;12(1):128. doi:10.1186/s13195-020-00697-0
40. Pekkala T, Hall A, Ngandu T, et al. Detecting Amyloid Positivity in Elderly With Increased Risk of Cognitive Decline. Front Aging Neurosci. 2020;12:228. doi:10.3389/fnagi.2020.00228
41. Escott-Price V, Sims R, Bannister C, et al. Common polygenic variation enhances risk prediction for Alzheimer’s disease. Brain. 2015;138(Pt 12):3673-3684. doi:10.1093/brain/awv268
42. Leonenko G, Shoai M, Bellou E, et al. Genetic risk for alzheimer disease is distinct from genetic risk for amyloid deposition. Ann Neurol. 2019;86(3):427-435. doi:10.1002/ana.25530
43. Escott-Price V, Myers AJ, Huentelman M, Hardy J. Polygenic risk score analysis of pathologically confirmed Alzheimer disease. Ann Neurol. 2017;82(2):311-314. doi:10.1002/ana.24999
44. Marengoni A, Rizzuto D, Fratiglioni L, et al. The Effect of a 2-Year Intervention Consisting of Diet, Physical Exercise, Cognitive Training, and Monitoring of Vascular Risk on Chronic Morbidity-the FINGER Randomized Controlled Trial. J Am Med Dir Assoc. 2018;19(4):355-360. doi:10.1016/j.jamda.2017.09.020
45. Solomon A, Stephen R, Altomare D, et al. Multidomain interventions: state-of-the-art and future directions for protocols to implement precision dementia risk reduction. A user manual for Brain Health Services-part 4 of 6. Alzheimers Res Ther. 2021;13(1):171. doi:10.1186/s13195-021-00875-8
46. Buccitelli C, Selbach M. mRNAs, proteins and the emerging principles of gene expression control. Nat Rev Genet. 2020;21(10):630-644. doi:10.1038/s41576-020-0258-4
47. Perneczky R, Guo LH. Plasma Proteomics Biomarkers in Alzheimer’s Disease: Latest Advances and Challenges. Methods Mol Biol. 2016;1303:521-529. doi:10.1007/978-1-4939-2627-5_32