K.J. Anstey1,2,3, M.H. Huque1,2,3, S. Kootar4, R. Eramudugolla1,2,3, M. Li1,2
1. School of Psychology, Matthews Building, University of New South Wales, UNSW Sydney NSW 2052, Australia; 2. Neuroscience Research Australia, Randwick, NSW, 2031, Australia; 3. UNSW Ageing Futures Institute, University of New South Wales, Sydney, 2052, Australia; 4. Sydney Children’s Hospital, Westmead, NSW, 2145, Australia
Corresponding Author: Professor Kaarin J. Anstey, School of Psychology, University of New South Wales, Kensington NSW 2052, Australia, Email: k.anstey@unsw.edu.au
J Prev Alz Dis 2024;6(11):1751-1758
Published online June 25, 2024, http://dx.doi.org/10.14283/jpad.2024.108
Abstract
Evidence-based dementia risk assessment is required to inform individual and policy-level dementia risk reduction interventions. We developed the CogDrisk Short Form (CogDrisk-SF) to assess dementia risk factors, for situations where time and resources are limited. To evaluate concurrent validity with the original CogDrisk, we conducted an online survey using a repeated-measures, counterbalanced design. Community dwelling participants (n = 647, 50.1% were female, mean age 62.2 years, age range 40-89) completed the survey. The mean(sd) score for CogDrisk-SF and the CogDrisk was 9.7 (5.3) and 9.9 (5.5), respectively. The intraclass correlation between the risk score obtained from CogDrisk and CogDrisk-SF was 0.92. Fish intake, insomnia and depression had percentage agreements of 79%, 87% and 89% respectively. Other items had >95% agreement except for loneliness (94%), hypertension (94%), cholesterol (93%), atrial fibrillation (91%) and cognitive activity (90%). Very high agreement between the CogDrisk-SF and original CogDrisk shows that CogDrisk-SF is valid for use in research and clinical practice.
Key words: Risk assessment, validation, dementia prevention, risk factor.
Introduction
Given the enormous projected prevalence of dementia globally (1), due to population ageing, there is an urgent need to identify all available methods to reduce risk of dementia. Addressing modifiable risk factors needs to be a key component of prevention strategies, with the Lancet Commission estimating up to 40% of cases may be attributable to twelve risk factors it identified in 2020 (2). In 2019, the World Health Organisation (WHO) also identified nine risk factors for which there is evidence that interventions are beneficial (3). Since the publication of these reports, the literature has continued to grow, as has the publication of statistical risk prediction models, often developed from single cohort studies (4). These statistical models are not necessarily designed with a focus on providing risk information to individuals. There are only a few examples (5-7) of translation of statistical models into practical, evidence-based risk assessment tools for use in clinics and by the general community. The ANU-ADRI was developed in 2013 and is one of the few late-life dementia risk tools that has been widely available through a website and is implemented in brain health clinics (8) and used in population modelling (9). It has a short version (10) which has been used as an outcome in clinical trials (11). However, the evidence base has grown dramatically since the ANU-ADRI (12) was developed.
The CogDrisk (13) was developed and validated (14, 15) to address the need for a low-cost, accessible up to date, late-life dementia risk assessment tool for use by clinicians, the community and policy makers, and to take into account an additional decade of evidence on dementia risk factors (2, 3, 16, 17). In brief, the risk factors included in the CogDrisk were drawn from an umbrella review of 91 meta-analyses reporting pooled estimates for 36 putative risk factors for Alzheimer’s disease, Vascular Dementia, and Any Dementia (16) as well as other recent reports (2, 3). The umbrella review considered midlife and late-life exposure, and the quality of the evidence available for each risk factors and outcome. In developing the CogDrisk (13), new pooled estimates were calculated for diabetes (men and women), mid-life obesity, mid-life cholesterol, stroke (with and without atrial fibrillation) to take into account the most recent evidence. We validated CogDrisk for predicting dementia in four cohort studies from the USA and Sweden (14, 15). The full CogDrisk tool includes 91 items of which 40 are not used directly in the calculation of the risk score. These items are included to support management of health risks in primary care and to provide information to assist in the interpretation of results or recommendations for intervention. For example, the full scale includes additional demographic information that would be used in a clinical assessment, such as questions on ethnicity, First Nations status, languages spoken, and far more dietary information than is included in the algorithm.
Purpose of the present study
The overall aim of our research program is to translate the highest quality evidence into tools that are of optimal use in the real world for dementia prevention. Given the limited time available for dementia risk assessment in clinical settings, and in large surveys, we identified a need for a minimal dementia risk factor assessment that only includes items contributing to the risk algorithm. We therefore developed a short form of the CogDrisk (CogDrisk-SF) and evaluated its agreement with the full version (concurrent validity). Differences in wording and formatting of responses in questionnaires can affect the response rates to individual items in surveys (18) so this evaluation was necessary to clarify whether the CogDrisk-SF would perform similarly to the CogDrisk in assessment of risk.
Methods
Participants and design
Participants were recruited via a survey company Qualtrics, a company that provides survey software and in Australia also provides opt-in market research panels to enable researchers to recruit samples. Qualtrics hold the demographic details of participants and this information is used to recruit samples with specific demographic characteristics. Potential participants (who required internet access) were provided with information on the survey title, expected duration and incentive for completion prior to opening their portal. Incentives are managed by the Qualtrics survey company and are intended as a token of appreciation and are approximately $4 to $5 for a 20-minute survey. We also conducted a pilot study of two independent groups using Qualtrics panels with one group completing the short form (n = 336) and the other completing the long form (n = 369) (participant demographics reported in supplementary material 1). The pilot study findings led to revisions to remove ambiguities in questions on head injury and medical conditions. The revised CogDrisk-SF is found in supplementary material 2.
For this study, a sample of 647 participants was obtained by Qualtrics. The sample was stratified by age (40-64 years, 65 years+), gender (male, female), and order of counterbalancing (SF first vs second). Ethical approval was obtained from the University of New South Wales Human Research Ethics Committee. We used a repeated-measures, counterbalanced design (ratio 1:1) such that each participant received both the CogDrisk and the CogDrisk-SF. These were programmed in the Qualtrics software and the survey was administered online. On consenting to participate in the study, participants received access to the Qualtrics survey that contained either the CogDrisk or the CogDrisk-SF first. Participants completed the CogDrisk-SF before the CogDrisk, or vice versa in a single session, according to a predetermined sequence. This was a within persons design and scores of the CogDrisk-SF were compared to the CogDrisk for the same participants.
CogDrisk questionnaire
The CogDrisk has been described previously (13). In brief, it includes 91 questions to assess 17 risk factors for dementia and the questions were drawn from previously validated scales. Risk factors include age, gender, years of education, self-reported height and weight (from which BMI is obtained, and WHO categories (19) applied), high cholesterol (>= 6.5 mmol/litre or self-report of being told by a health professional that a person has high cholesterol) (20), diabetes, stroke, traumatic brain injury, hypertension, atrial fibrillation, depression (>20 on the Centre for Epidemiological Studies Depression Scale (21)), physical inactivity (assessed with the International Physical Activity Questionnaire (IPAQ) as < 150 mins per week of moderate to vigorous activity (22)), cognitive engagement, social engagement, diet and smoking. Obesity, hypertension and high cholesterol are only included in the total score for mid-life participants.
Development of the short form of the CogDrisk
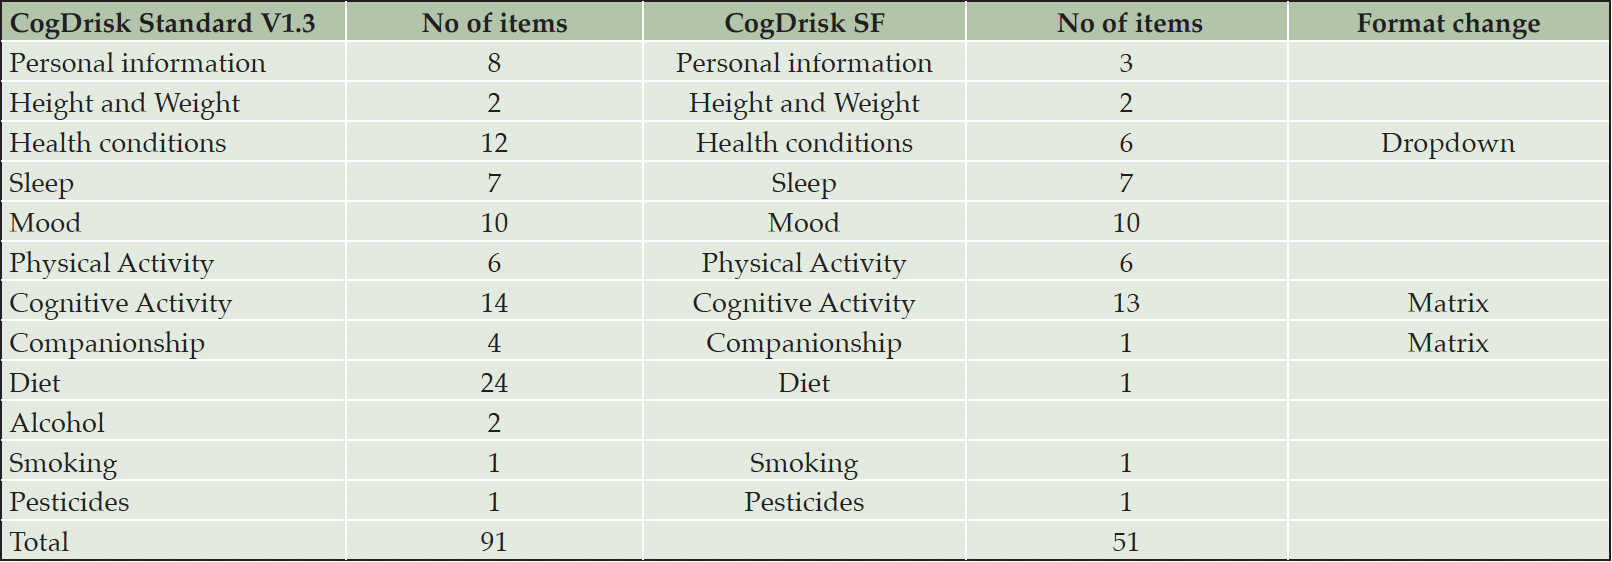
When evaluating the validity of the short form of the ANU-ADRI, accuracy was lost due to shortening of measurement scales such as the IPAQ and social, and cognitive engagement scales (10). We therefore decided to retain all items of measurement scales in CogDrisk. The research team developed the draft short form questionnaire by eliminating items in the CogDrisk that do not contribute to the information used in the scoring algorithm, and reformatting or re-wording responses so that matrix tables and multiple-choice options were used where possible (Table 1). We evaluated the validity of the CogDrisk-SF by comparing the total score, with the CogDrisk total score. We also compared the frequencies of endorsement of individual risk factors between the two versions. In the current study the lowest level of education included in the original CogDrisk development (13) (<8 years) was inadvertently omitted from the Education variable in both versions so this did not affect the comparison between them (Supplementary material).
Statistical power and analysis
In order to calculate sample size, we considered two different research questions: (i) whether both the short and long form have a similar ability to predict dementia and (ii) whether risk factor profiles are equally captured in both the short and long form. As the CogDrisk score was developed from research synthesis which utilized data from older adults’ information (>65 years and older), the CogDrisk scores obtained for middle aged adults are suboptimal. Therefore, to estimate the sample size, we utilized the prevalence of risk factors to quantify the risk profile. We assumed that prevalence of depression, diabetes and social isolation in the short form was 40%, 14% and 41%, respectively based on our prior study (10) and the associated figure for the long form was 35%, 8% and 49% (using unpublished data from self-reported conditions from 6171 participants who consented to have their data saved for research from the CogDrisk website). An intraclass correlation (ICC) of > 0.9 is considered acceptable (23) for agreement of short form with longer form questionnaires. Considering 5% level of significance and 80% power, aiming for an ICC of 0.9, we estimated that sample sizes of 627, 153 and 282 respectively, would be required to detect the assumed difference in prevalence of depression, diabetes, and social isolation, between forms. Therefore, we estimated that a minimum sample size of 632 (rounding up due to age- sex stratification and counterbalancing) would be sufficient to capture the difference in prevalence (if any) for depression, diabetes, and social isolation. To obtain this sample, Qualtrics oversampled individuals and collected information from 647 individuals completing both the surveys. Descriptive statistics, Chi-square test statistics with p-value, % agreement, Cohen’s kappa (95% CI) and Intra-cluster correlation (ICC) were used to evaluate the agreement between versions. ICC was calculated based on multilevel linear and logistic mixed effect models for continuous and categorical variables, respectively. Stata statistical software: Release 16, (College Station TX; StataCorp LLC) was used for sample size calculation and statistical analyses.
Results
Characteristics of participants
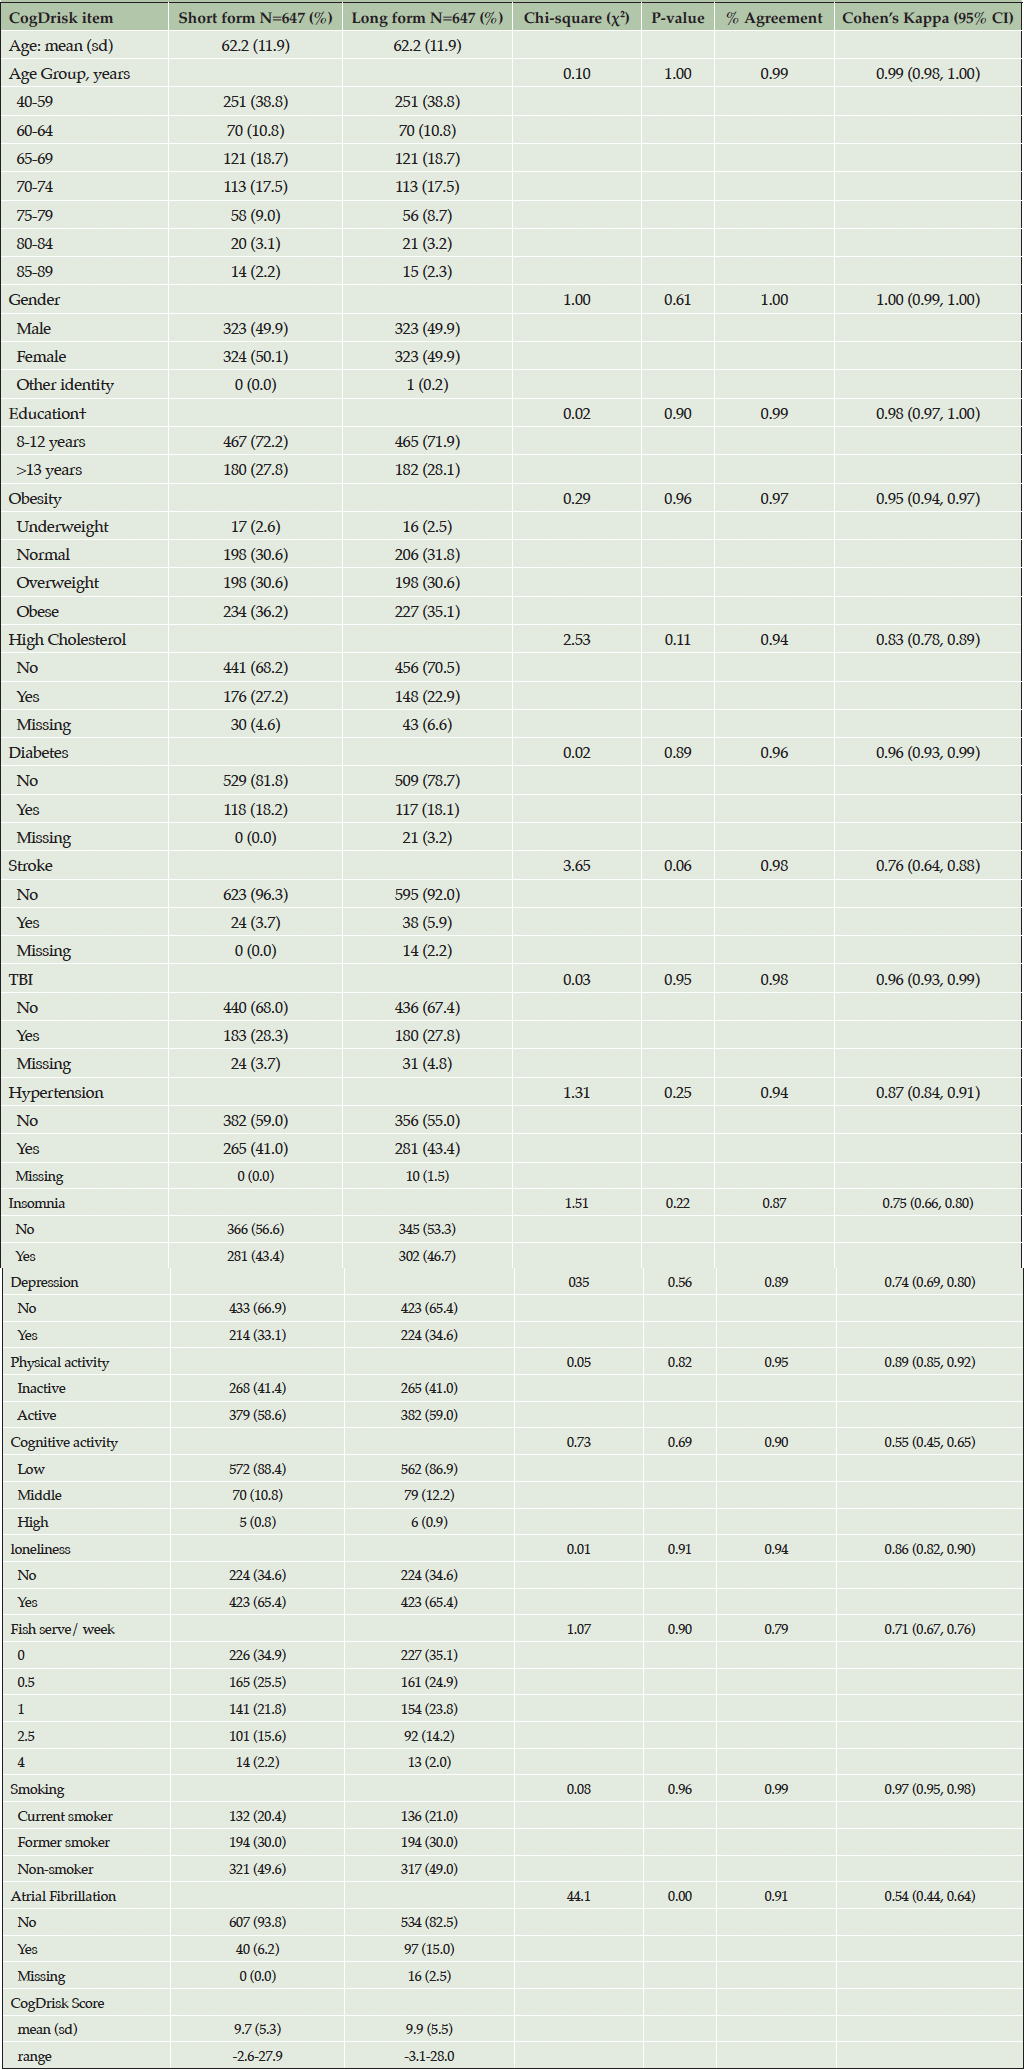
The sample comprised 647 participants (50.1% female, Mean Age 62.2, age range 40-89) who completed the study online. Of the sample, 16.8% completed the school certificate or equivalent, and 26% completed post school qualifications. The CogDrisk questionnaire took 15.3 minutes, and the CogDrisk-SF questionnaire took 9.8 minutes to complete. Descriptive statistics for the sample are shown in Table 2.
†Note: highest qualification was converted to year of education as: 8-12 for school certificate or equivalent or higher school certificate (or equivalent) or Trade certificate/apprenticeship or Technician’s certificate/advanced certificate or Certificate other than above or Associate diploma. >13 years if Undergraduate diploma or Bachelor’s or Post graduate diploma/certificate or Higher degree.
Overall agreement between versions
The total scores were 9.7 (SD=5.3) and 9.9 (SD = 5.5) for the CogDrisk-SF and CogDrisk respectively. The ICC was 0.92.
Agreement between versions on individual risk factors
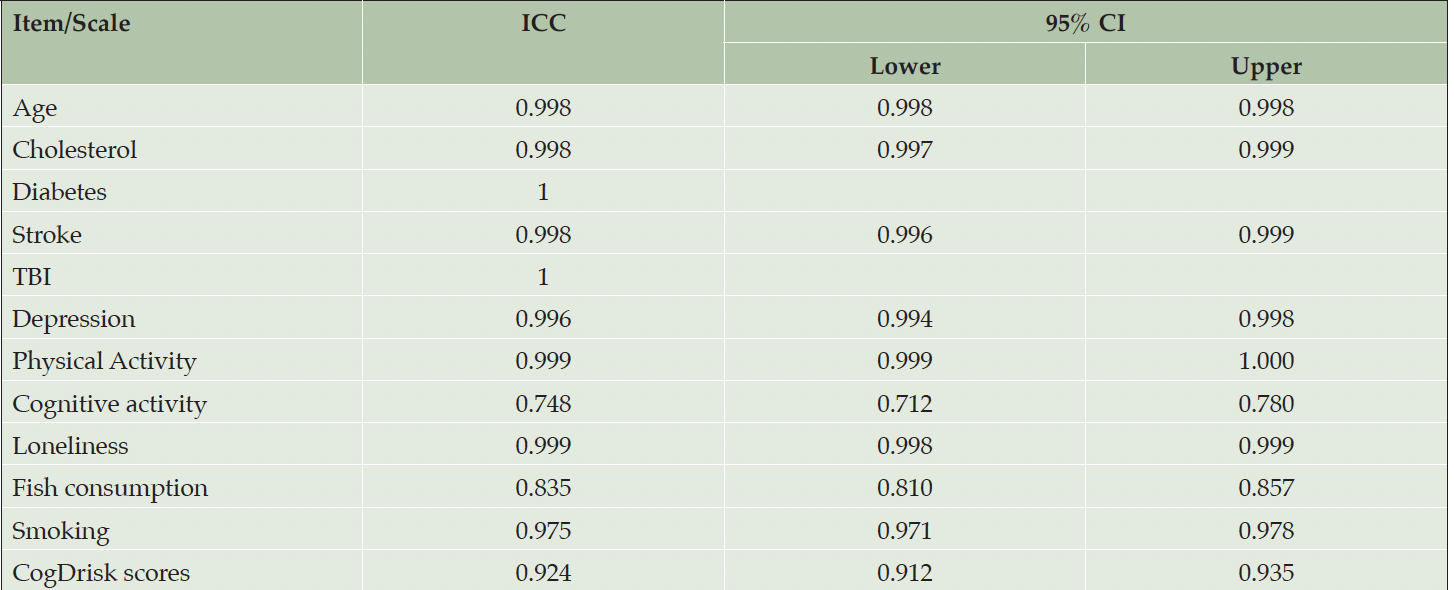
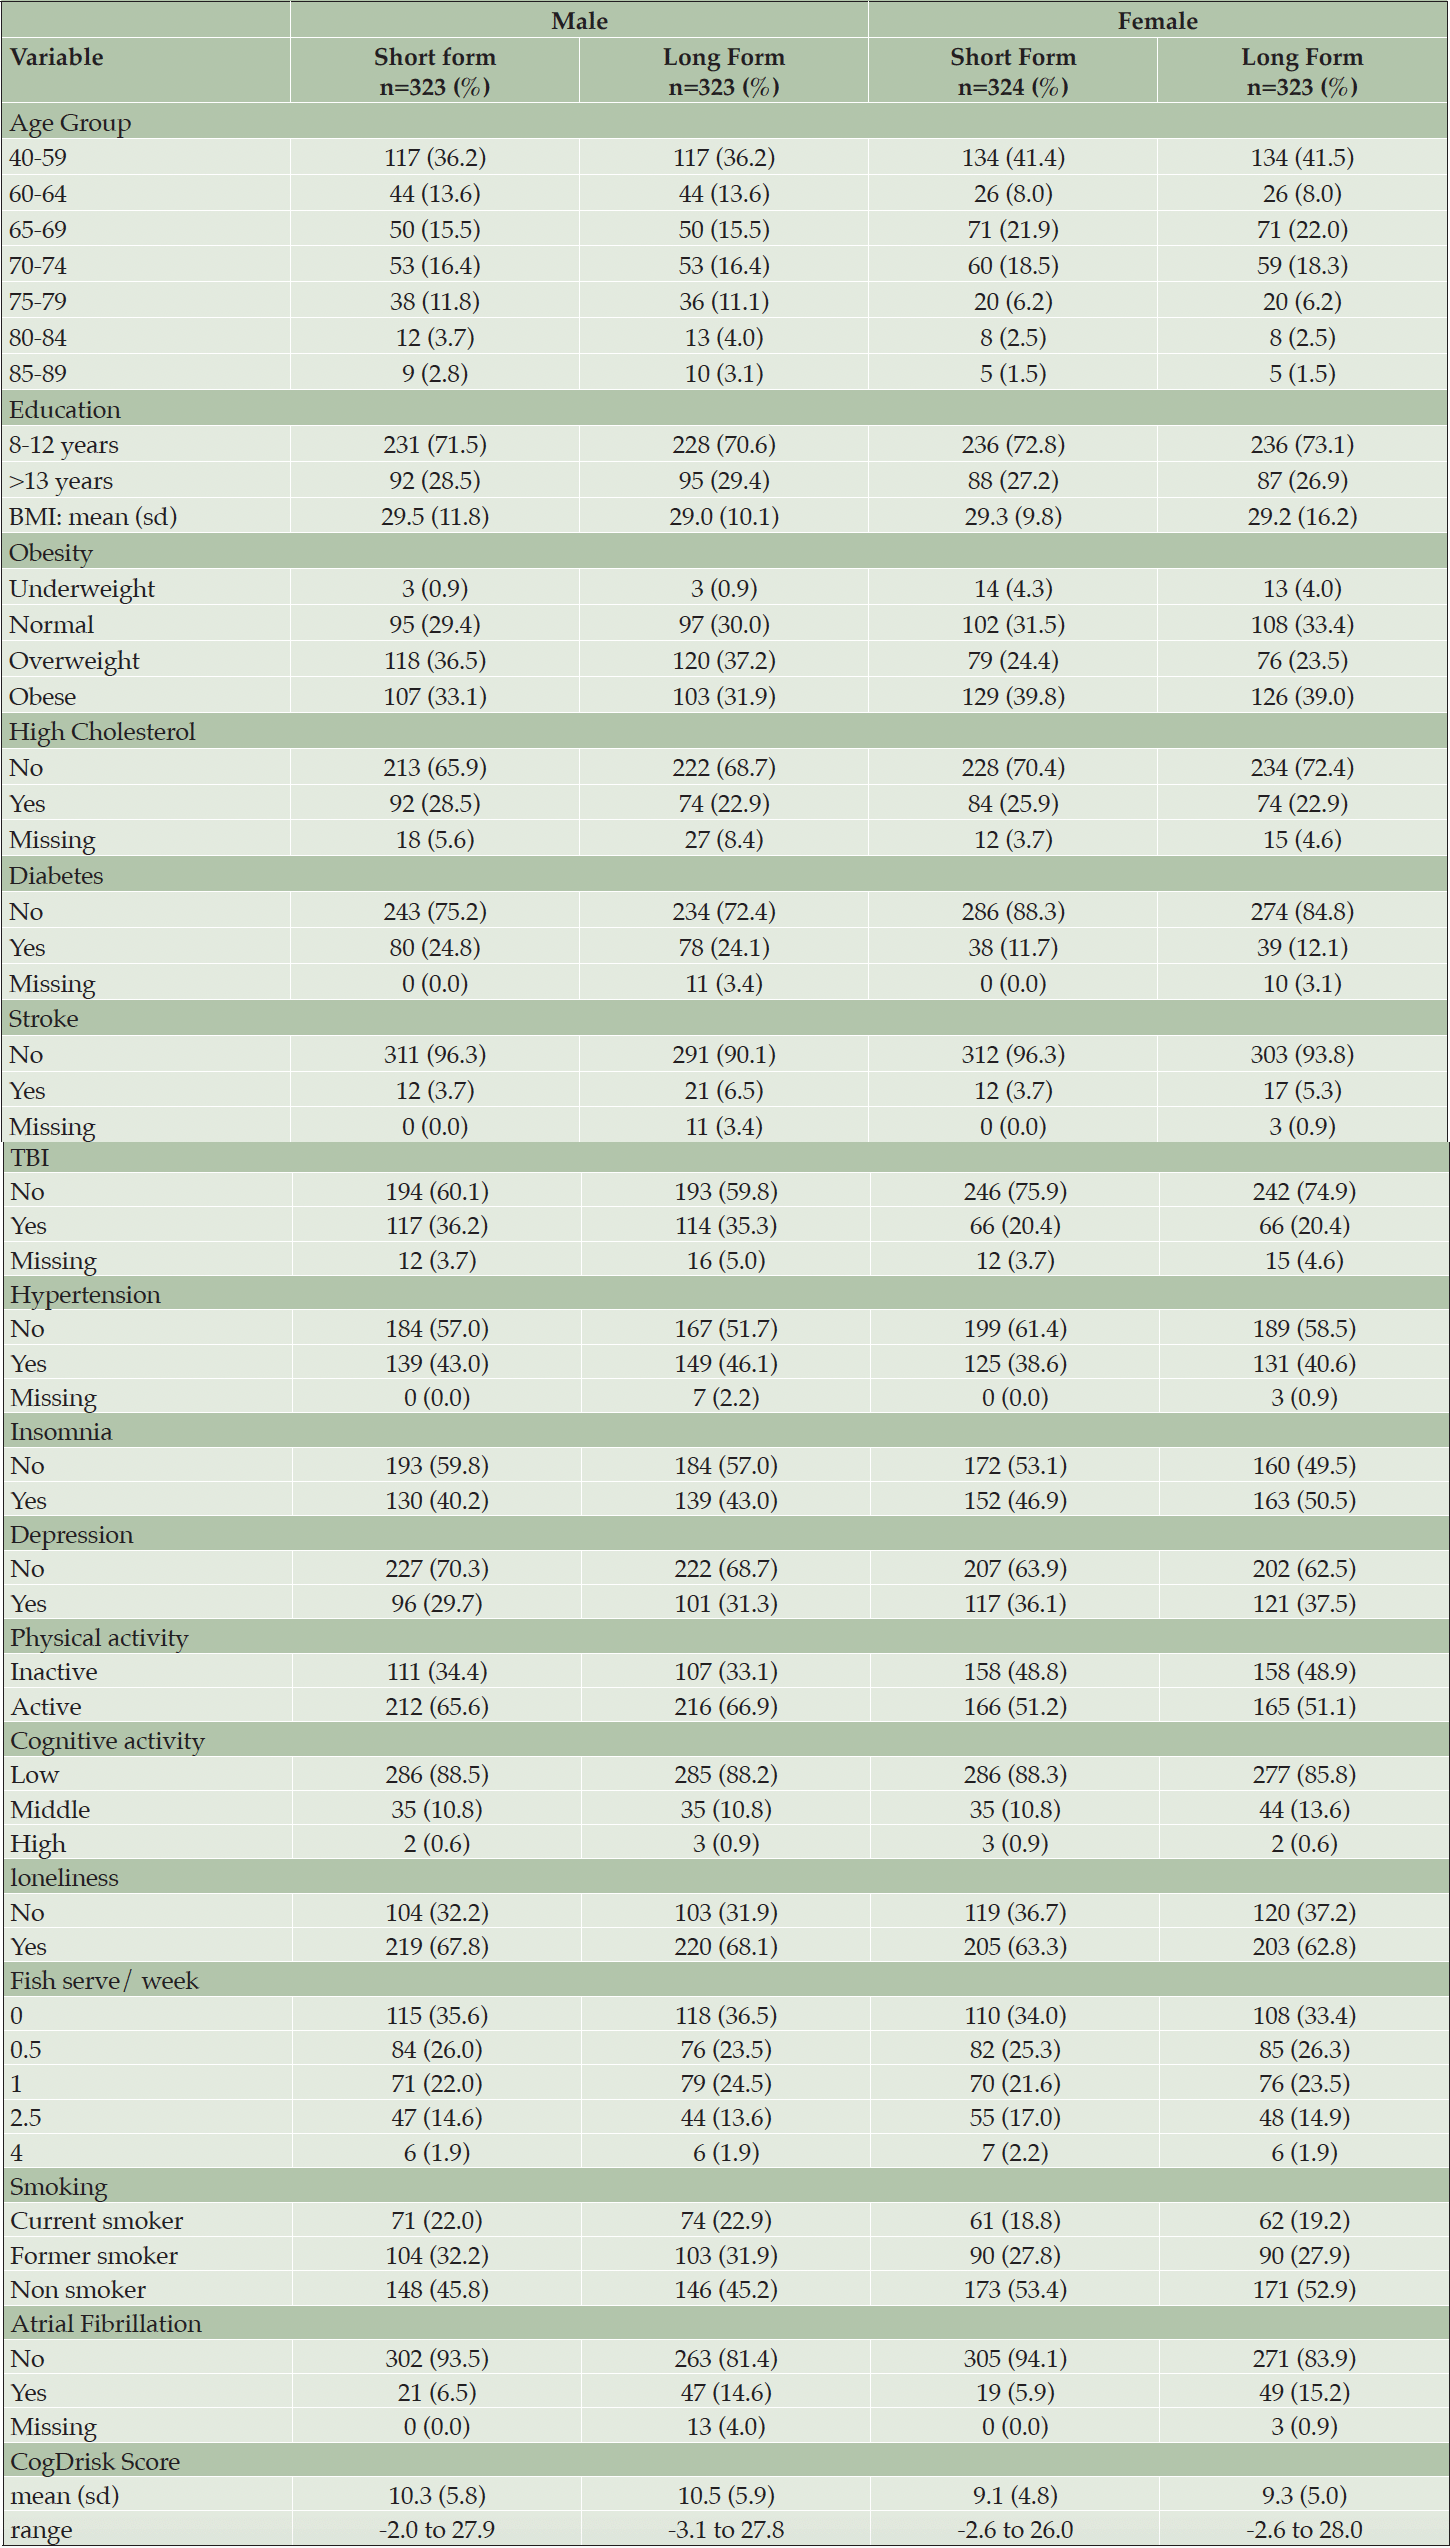
The number of participants meeting self-reported criteria for each risk factor, using both the CogDrisk SF and the CogDrisk, is shown in Table 2. Agreement between versions was high (over 78%) for each individual risk factor. Fish intake, insomnia and depression had the largest discrepancies with percentage agreements of 79%, 87% and 89% respectively, due to combining multi-item responses followed by dichotomization of these variables in both short and long form. Other items had >95% agreement between SF and LF except for loneliness (94%), hypertension (94%), high cholesterol (93%), atrial fibrillation (91%) and cognitive activity (90%). There was no statistically significant difference in proportions of the sample reporting each risk factor except for atrial fibrillation. In the long form 15% of the sample endorsed this risk factor, but only 6% endorsed it in the short form. We note that 2.5% of the responses of the long version are missing for this item (participant responses do not know are considered missing). Some measures were identical in each version but did not have perfect agreement between the short and long forms of the overall scale, indicating that people vary in their responses even within one testing occasion. For example, both risk scores use the 10-item CES-D, to assess depressive symptoms. Table 3 reported the ICC (95% CI) of various items/scales of the CogDrisk short form and CogDrisk. The ICC (95% CI) of CogDrisk score between CogDrisk short form and CogDrisk is 0.92 (0.91, 0.94). Results for individual risk factors for men and women are reported in Table 4.

Table 3. Intra class correlation (ICC) coefficients between scales or items of the CogDrisk short form and CogDrisk
Discussion
There is now a large amount of evidence on risk factors for dementia (2, 3), which needs to be translated into meaningful tools and interventions that enable individuals and communities to evaluate their modifiable risk factors for dementia (24). CogDrisk was developed to meet this need and the short form addresses the further need for a brief version of the assessment. Our study found very high agreement (25) between the CogDrisk-SF and CogDrisk, showing that CogDrisk-SF is valid for use in research and clinical practice. The only other short form of a dementia risk tool that we have identified is the ANU Alzheimer’s Disease Risk Index Short Form, also developed by our team. That tool was developed specifically to assess measures for Alzheimer’s disease (12) and used a similar methodology to the CogDrisk. Our findings show that at the individual item and scale level there is some variability within participants even within one occasion of measurement. There was variation in responses for identical versions of questionnaires (e.g. the CES-D 10 item depression scale) indicating that there is some response variability which is inevitable. This is informative for risk assessment in general.
The largest difference between versions was seen for assessment of self-reported atrial fibrillation. This is likely due to the differences in wording. In the long form of CogDrisk there is more explanation of atrial fibrillation given in the question i.e. Have you ever been told by your doctor that you have a heart condition like atrial fibrillation/arrhythmias (irregular heartbeats) with/without stroke? (Yes/No/Don’t know). Whereas in the short form it was presented as one of a list of medical conditions that the respondent could select, which captured fewer positive responses. As a result, we propose to add ‘irregular heartbeats’ in brackets after the question on atrial fibrillation in the CogDrisk-SF.
The agreement between individual risk factors in each version was higher than that reported in a study comparing the ANU-Alzheimer’s Disease Risk Index (ANU-ADRI) with a short form of the ANU-ADRI (ANU-ADRI-SF) (10). The agreement between the ANU-ADRI-SF and the ANU-ADRI for fish consumption was ICC= 0.772 (0.631–0.849) whereas the ICC for the agreement between the CogDrisk-SF and CogDrisk for fish consumption was 0.835 (0.810-0.857). Most notable, the ICC for cognitive activity was 0.748 (0.712, 0.780) for the CogDrisk forms, in comparison to 0.031 (-0.084 to 0.147) for the ANU-ADRI forms. The higher concurrent validity of the CogDrisk is likely due to retaining the full-length scales for most measures in the CogDrisk-SF. The current study included a larger sample size compared with the ANU-ADRI-SF (10) and other research that compared reliability of the ANU-ADRI in cross-cultural populations (26, 27). The larger ICC obtained in this paper may be due to the large sample size.
The current study had both strengths and limitations. Sourcing participants from a survey company may not reflect the diversity in the population and may introduce sources of bias related to characteristics of people who volunteer for such studies. The within-person design mitigated this to some extent. The experience of completion of the survey via Qualtrics software may differ from administration in a clinical setting or via the CogDrisk website. The questionnaire was presented in English which does not allow for evaluation of the questionnaire instrument in other languages. Strengths included the relatively large sample size and conduct of a pilot study.
We conclude that the CogDrisk-SF is valid for use in clinical and research settings and provides accurate overall dementia risk assessment. Where greater demographic characterisation of respondents is required, or more detail on alcohol consumption, health conditions, cognitive engagement, diet, and sleep habits, the original CogDrisk is recommended.
Acknowledgements: KJA and HH are funded by Australian Research Council Fellowship FL190100011. The funder had no role in the design, conduct, analysis, interpretation, or decision to publish the project. HH had full access to all the data in the study and takes responsibility for the integrity of the data and accuracy of the data analysis.
Funding: There is no project-specific funding. We acknowledge contribution of a NeuRA Discovery Grant to KJA. Open Access funding enabled and organized by CAUL and its Member Institutions.
Conflict of interest: There are no conflicts of interest.
Ethical standards: Ethical approval was obtained from the University of New South Wales Human Research Ethics Committee.
Open Access: This article is distributed under the terms of the Creative Commons Attribution 4.0 International License (http://creativecommons.org/licenses/by/4.0/), which permits use, duplication, adaptation, distribution and reproduction in any medium or format, as long as you give appropriate credit to the original author(s) and the source, provide a link to the Creative Commons license and indicate if changes were made.
References
1. Collaborators GBDDF. Estimation of the global prevalence of dementia in 2019 and forecasted prevalence in 2050: an analysis for the Global Burden of Disease Study 2019. Lancet Public Health. Feb 2022;7(2):e105-e125. doi:10.1016/S2468-2667(21)00249-8
2. Livingston G, Huntley J, Sommerlad A, et al. Dementia prevention, intervention, and care: 2020 report of the Lancet Commission. Lancet. Aug 8 2020;396(10248):413-446. doi:10.1016/S0140-6736(20)30367-6
3. WHO. Risk Reduction of Cognitive Decline and Dementia: WHO guidelines 2019.
4. Stephan BCM, Pakpahan E, Siervo M, et al. Prediction of dementia risk in low-income and middle-income countries (the 10/66 Study): an independent external validation of existing models. Lancet Glob Health. Apr 2020;8(4):e524-e535. doi:10.1016/S2214-109X(20)30062-0
5. Schiepers OJG, Kohler S, Deckers K, et al. Lifestyle for Brain Health (LIBRA): a new model for dementia prevention. Int J Geriatr Psychiatry. Jan 2018;33(1):167-175. doi:10.1002/gps.4700
6. Enache D, Solomon A, Cavallin L, et al. CAIDE Dementia Risk Score and biomarkers of neurodegeneration in memory clinic patients without dementia. Neurobiol Aging. Jun 2016;42:124-31. doi:10.1016/j.neurobiolaging.2016.03.007
7. Exalto LG, Quesenberry CP, Barnes D, Kivipelto M, Biessels GJ, Whitmer RA. Midlife risk score for the prediction of dementia four decades later. Alzheimer’s & dementia : the journal of the Alzheimer’s Association. Sep 10 2013;doi:10.1016/j.jalz.2013.05.1772
8. Ranson JM, Rittman T, Hayat S, et al. Modifiable risk factors for dementia and dementia risk profiling. A user manual for Brain Health Services-part 2 of 6. Alzheimers Res Ther. Oct 11 2021;13(1):169. doi:10.1186/s13195-021-00895-4
9. Bagheri N, Wangdi K, Cherbuin N, Anstey KJ. Combining Geospatial Analysis with Dementia Risk Utilising General Practice Data: A Systematic Review. J Prev Alzheimers Dis. 2018;5(1):71-77. doi:10.14283/jpad.2017.33
10. Kim S, Cherbuin N, Anstey KJ. Assessing reliability of short and tick box forms of the ANU-ADRI: Convenient alternatives of a self-report Alzheimer’s disease risk assessment. Alzheimers Dement (N Y). Jun 2016;2(2):93-98. doi:10.1016/j.trci.2016.03.001
11. Heffernan M, Andrews G, Fiatarone Singh MA, et al. Maintain Your Brain: Protocol of a 3-Year Randomized Controlled Trial of a Personalized Multi-Modal Digital Health Intervention to Prevent Cognitive Decline Among Community Dwelling 55 to 77 Year Olds. J Alzheimers Dis. 2019;70(s1):S221-S237. doi:10.3233/JAD-180572
12. Anstey KJ, Cherbuin N, Herath PM. Development of a New Method for Assessing Global Risk of Alzheimer’s Disease for Use in Population Health Approaches to Prevention. Prevention science Jan 16 2013;14(4):411-421. doi:10.1007/s11121-012-0313-2
13. Anstey KJ, Kootar S, Huque MH, Eramudugolla R, Peters R. Development of the CogDrisk tool to assess risk factors for dementia. Alzheimers Dement (Amst). 2022;14(1):e12336. doi:10.1002/dad2.12336
14. Huque MH, Kootar S, Eramudugolla R, et al. CogDrisk, ANU-ADRI, CAIDE, and LIBRA Risk Scores for Estimating Dementia Risk. JAMA Netw Open. Aug 1 2023;6(8):e2331460. doi:10.1001/jamanetworkopen.2023.31460
15. Kootar S, Huque MH, Eramudugolla R, et al. Validation of the CogDrisk Instrument as Predictive of Dementia in Four General Community-Dwelling Populations. J Prev Alzheimers Dis. 2023;10(3):478-487. doi:10.14283/jpad.2023.38
16. Anstey KJ, Ee N, Eramudugolla R, Jagger C, Peters R. A Systematic Review of Meta-Analyses that Evaluate Risk Factors for Dementia to Evaluate the Quantity, Quality, and Global Representativeness of Evidence. J Alzheimers Dis. 2019;70(s1):S165-S186. doi:10.3233/JAD-190181
17. Anstey KJ, Zheng L, Peters R, et al. Dementia Risk Scores and Their Role in the Implementation of Risk Reduction Guidelines. Front Neurol. 2021;12:765454. doi:10.3389/fneur.2021.765454
18. Choi BC, Pak AW. A catalog of biases in questionnaires. Prev Chronic Dis. Jan 2005;2(1):A13.
19. WHO. Physical Status: The Use and Interpretation of Anthropometry: Report of a World Health Organization (WHO) Expert Committee. 1995.
20. Kivipelto M, Helkala EL, Laakso MP, et al. Midlife vascular risk factors and Alzheimer’s disease in later life: longitudinal, population based study. BMJ Jun 16 2001;322(7300):1447-51.
21. Radloff L. The CES-D Scale: a self report depression scale for research in the general population. Journal of Applied Psychological Measurement. 1977;3:385-401.
22. Craig CL, Marshall AL, Sjostrom M, et al. International physical activity questionnaire: 12-country reliability and validity. Med Sci Sports Exerc. Aug 2003;35(8):1381-95. doi:10.1249/01.MSS.0000078924.61453.FB
23. Kleka P, Soroko E. How to avoid the sins of questionnaires abridgement. Survey Research Methods. 2018;12(2):147-160.
24. WHO. Global Action Plan on the Public Health Response to Dementia 2017-2025. 2017.
25. Liljequist D, Elfving B, Skavberg Roaldsen K. Intraclass correlation – A discussion and demonstration of basic features. PLoS One. 2019;14(7):e0219854. doi:10.1371/journal.pone.0219854
26. Bayram S, Akkas OA. Adaptation of the Australian National University Alzheimer’s Disease Risk Index-Short Form (ANU-ADRI-SF) into Turkish. Int J Older People Nurs. Mar 2024;19(2):e12608. doi:10.1111/opn.12608
27. Borges MK, Jacinto AF, Citero VA. Validity and reliability of the Brazilian Portuguese version of the Australian National University – Alzheimer’s Disease Risk Index (ANU-ADRI). Dement Neuropsychol. Jul-Sep 2018;12(3):235-243. doi:10.1590/1980-57642018dn12-030003
© The Authors 2024


