
D.X. Guan1, K. Rockwood2, E.E. Smith3, Z. Ismail3
1. University of Toronto, Toronto, ON, Canada; 2. Divisions of Geriatric Medicine & Neurology, Dalhousie University, Halifax, NS, Canada; 3. Hotchkiss Brain Institute, University of Calgary, Calgary, AB, Canada
Corresponding Author: Zahinoor Ismail, 3280 Hospital Dr. NW Calgary AB, Canada T2N 4Z6, 403-210-6900, ismailz@ucalgary.ca, @11thCCD
J Prev Alz Dis 2022;4(9):692-700
Published online June 21, 2022, http://dx.doi.org/10.14283/jpad.2022.61
Abstract
BACKGROUND: Frailty has been associated with cognitive markers of dementia but its relationship with behavioral markers of dementia are poorly understood.
OBJECTIVES: To investigate the association between frailty and mild behavioral impairment (MBI), and whether this association is moderated by sex.
DESIGN: Cross-sectional observational study.
PARTICIPANTS/SETTING: 219 non-dementia participants (cognitively normal and mild cognitive impairment) from the Comprehensive Assessment of Neurodegeneration and Dementia (COMPASS-ND) study.
MEASUREMENTS: Frailty was measured using the frailty index (FI) with higher scores indicating more health deficits/greater frailty. MBI symptoms were derived from Neuropsychiatric Inventory Questionnaire scores using a published algorithm with a cut-off of >0 indicating MBI symptom presence and higher scores indicating greater severity. Multivariable logistic and linear regressions adjusted for age, sex, education, and cognitive diagnosis were used to test the association between FI and MBI symptom presence and severity, respectively, with MBI as the outcome variable. An FI-by-sex interaction term was included to test for sex-dependent effects.
RESULTS: The FI mean and SD across the entire cohort was 0.14 ± 0.06 (median = 0.14, IQR = 0.09–0.17, range = 0.02–0.38). Higher FI scores were associated with the presence of MBI symptoms both globally and in the domains of decreased motivation, affective dysregulation, and psychosis. Higher FI scores were also associated with more severe MBI symptoms in a sex-dependent manner: both sexes reported similarly low MBI symptom severity at low (-1 SD) levels of FI but males reported 1.9x higher MBI symptom severity relative to females at high (+1 SD) levels of FI.
CONCLUSIONS: The FI is associated with both the presence and severity of MBI, especially for males. This suggests that screening for early dementia risk should incorporate assessments of MBI for patients with frailty, and assessments of frailty for patients with MBI.
Key words: Frailty, mild behavioral impairment, neuropsychiatric symptoms, non-cognitive dementia markers, dementia, Alzheimer’s disease.
Introduction
To facilitate the development and testing of new therapeutics designed to treat, alter, or even prevent the onset and progression of dementia, it is critical for researchers and clinicians to be able to identify the disorder during its early stages (1, 2). Increasingly, dementia is seen as a multifactorial condition that arises in the context of multiple medical and social factors which commonly interact (3). This likely reflects its strong relationship with age: most cases of dementia in Canada are diagnosed in people between the ages of 75 and 95 (4). Given these relationships with age and a range of associated factors, older adults who live with frailty face an increased risk for dementia (5-9). Three separate meta-analyses representing over 15 longitudinal studies have robustly shown that older adults who classified as frail are at greater risk of incident dementia (7-9).
Frailty refers to “a state of increased vulnerability to poor resolution of homeostasis after a stressor event, which increases the risk of adverse outcomes, including falls, delirium, and disability” (10). It is often measured using a frailty phenotype, which views frailty as a clinical syndrome, or a deficit accumulation frailty index (FI), which considers frailty as a health state and aims to quantify it based on cumulative health deficits (11, 12). A growing body of evidence has demonstrated a link between the FI and early cognitive deficits indicative of an increased risk for incident dementia. In a longitudinal study of 625 participants with no cognitive impairment, mild cognitive impairment (MCI), or dementia from the Rush Memory and Aging Project (MAP), the FI was associated with worse cognition and dementia status independently of measures of traditional dementia neuropathology (6). Likewise, in a study of 14,490 participants from the National Alzheimer’s Coordinating Center (NACC), higher FI values were associated with an increased risk of the development of MCI in those with no cognitive impairment (5). However, despite being the hallmark symptom of prodromal dementia, the use of early cognitive symptoms alone to predict incident dementia still has much room for improvement (13). Only 10-15% of patients with MCI progress to dementia annually, whereas approximately one-third revert back to normal cognition or remain stable (14). Furthermore, other studies have shown that the link between cognitive impairment and Alzheimer’s disease (AD) neuropathology remains weak (15). To address this concern, it is important to consider how frailty relates to other non-cognitive markers of dementia risk, which can be assessed non-invasively and efficiently in clinical settings by physicians and researchers alike to aid in the prediction of incident dementia.
Mild behavioral impairment (MBI) is a neurobehavioral syndrome that captures the de novo emergence of persistent neuropsychiatric symptoms (NPS) in older adults, which represent a change from longstanding behavior or personality, as an at-risk state for incident cognitive decline and dementia (16, 17). MBI symptoms fall into five domains: decreased drive and motivation (apathy), affective dysregulation (mood and anxiety symptoms), impulse dyscontrol (agitation, aggression, impulsivity), social inappropriateness (impaired social cognition) and abnormal perception or though content (psychotic symptoms including hallucinations and delusions). Data from several thousands of participants from NACC and PROTECT studies have shown that MBI symptoms are not only associated with steeper cognitive decline and the eventual progression to dementia, but may even precede the diagnosis of MCI (18-20). Relevant to prodromal dementia, recent evidence has demonstrated that adding behavioral risk (i.e., MBI) to cognitive risk (i.e., MCI) results in better dementia prognostication. In a sample of 739 participants with MCI, MBI was associated with a higher likelihood of progression to dementia (14.7% vs 8.3 annual progression rate) and a lower likelihood of reversion to normal cognition (2.5% vs 5.3% annual reversion rate), relative to MCI without MBI (21). A number of recent studies have also demonstrated associations between MBI and early AD neuropathology including β-amyloid and phospho-tau in pre-dementia cohorts, suggesting that MBI can enrich samples for preclinical and prodromal Alzheimer’s disease (22-24).
Both the recent Canadian Consensus Conference on the Diagnosis and Treatment of Dementia (CCCDTD5) (25, 26) and the 2021 World Alzheimer Report (27) have recommended incorporating MBI, along with other non-cognitive markers of dementia, for more thorough dementia risk assessments. Notably, symptoms of MBI have been associated cross-sectionally with impaired gait (28) and hearing loss (29, 30), two other non-cognitive dementia markers (25, 26). While the relationship between frailty and cognitive impairment is established and growing, significantly fewer studies have investigated how frailty relates to early-stage behavioral changes that are indicative of increased dementia risk. One study has shown cross-sectionally that the frailty phenotype is associated with MBI status (31) but, to our knowledge, no studies have examined the relationship between frailty and MBI using the FI, or the relationship between frailty and the severity of MBI symptoms.
In addition to associations with cognitive decline and dementia, both frailty and MBI have demonstrated sex differences in prevalence and/or severity. A systematic review and meta-analysis of 7 studies found that females tended to have higher FI scores than males in every age group (32). However, despite having higher FI scores than males on average, females still tend to fare better by having lower lethality rates at any given level of frailty than males, in a phenomenon that has been termed the male-female health-survival paradox (33). In contrast, earlier work and preliminary data on MBI and its domains have generally concluded the opposite trend: MBI symptoms are more prevalent and severe in males than in females (34-36). The purpose of this study was two-fold: to investigate the association between frailty and MBI in a non-dementia cohort and to characterize the potential role of sex in this relationship. We hypothesized that higher levels of FI would be associated with greater MBI total symptom severity and that, given the male-female health-survival paradox and increased severity of MBI in males, this association would be stronger in males than in females.
Methods
Participants
Participant data were drawn from the Comprehensive Assessment of Neurodegeneration and Dementia (COMPASS-ND) study. COMPASS-ND is a Canada-wide multi-center observational cohort study (clinicaltrials.gov: NCT03402919) coordinated by the Canadian Consortium on Neurodegeneration in Aging. Patients with varying cognitive diagnoses and complaints aged 50-90 years old are recruited primarily from specialty cognitive clinics and non-clinical community-dwelling settings at 31 sites across Canada. Written informed consent was obtained from all participants, and ethics approval was obtained from the research ethics committee at each site. Additional details for the COMPASS-ND study and its participant recruitment methods have been published elsewhere (37, 38). This study included only dementia-free participants (n = 256) from the COMPASS-ND February 2020 data release (n = 409) who were classified as cognitively normal (CN; n = 10) or diagnosed with subjective cognitive decline (SCD; n = 58) or MCI (n = 188). Participants were excluded if they were missing NPI-Q data (n = 37).
Measures
The COMPASS-ND study collects sociodemographic, clinical, neuropsychological, biomarker, and neuroimaging data from its participants. Of relevance here were baseline demographic variables such as age, sex, and education which were recorded during the initial screening visit, and cognitive diagnosis (CN, SCD, or MCI) which was determined at the same visit by a study physician based on all available clinical and research information at the time (38).
Frailty was operationally defined using an existing COMPASS-ND application of the FI (39). The FI quantitatively measures the degree of frailty as a state of deficit accumulation (40), and is generally computed as the number of health deficits present divided by the total number of health deficits considered (41). Values of FI therefore range from 0 to 1, with higher values indicating a more severe state of health deficit accumulation. The COMPASS-ND iteration of the FI contains 81 items that fall under the categories of Basic Activities for Daily Living (6 items), Instrumental Activities for Daily Living (7 items), Quality of Life (6 items), Clinical Assessment (61 items), and Low Activity (1 item). To ensure that the FI was unbiased across the neurodegenerative spectrum of disorders present in the COMPASS-ND cohort, this version excluded items related to neurological disease. Furthermore, the FI did not contain any of the items that were used to approximate MBI in this study. To visualize the presence of MBI symptoms across the FI range, MBI symptom prevalence was plotted against 0.1 intervals of the FI: ≤ 0.10, 0.11–0.20, and ≥ 0.21, which have previously been differentially associated with mortality in cognitively normal older adults (42). Otherwise, the FI was treated as a continuous variable for regression modeling.
The presence and severity of NPS were evaluated using the Neuropsychiatric Inventory Questionnaire (NPI-Q) (43), which was completed by a primary informant during the baseline clinical visit. From these data, MBI total and domain symptom scores were derived using a published algorithm (44). Specifically, the MBI decreased motivation domain score (range = 0–3) was derived from the NPI-Q apathy subscale; emotional dysregulation (range = 0–9) from the NPI-Q depression, anxiety, and elation subscales; impulse dyscontrol (range = 0–9) from the NPI-Q agitation, irritability, and motor behaviour subscales; social inappropriateness (range = 0–3) from the NPI-Q disinhibition subscale; and abnormal perception or thought content (range = 0–6) from the NPI-Q delusions and hallucinations subscales. Global MBI symptom severity (range = 0–30) was calculated as the sum of the scores from each MBI domain such that larger values represented greater MBI symptom burden. These scores were used to generate a dichotomous variable (MBI symptom status) using a cut-off of >0 to indicate the presence of global or domain-specific MBI symptoms, and a continuous variable (MBI symptom severity), both for incorporation into regression modeling.
Statistical Analyses
Descriptive statistics (means, standard deviations, ranges, counts, percentages) were used to summarize participant characteristics for the entire non-dementia cohort stratified by sex. Differences between males and females in demographic, neuropsychological, frailty, and MBI variables were tested using independent-samples t-tests for continuous variables or chi-square and Fisher’s exact tests for categorical variables, as appropriate. Group differences were considered to be significant using a statistical significance threshold of p < .05. The same tests were also conducted to compare demographic characteristics and FI values for participants included in the final sample to participants who were excluded for missing NPI-Q data. To test the association between FI and MBI symptom status, separate multivariable logistic regressions were fitted with FI as the primary predictor variable and global or domain-specific MBI symptom status as the outcome variable. A multivariable linear regression was used to test the association between FI (predictor variable) and total MBI symptom severity (outcome variable). Furthermore, an FI-by-sex interaction term was included in the linear regression model to identify potential sex-dependent effects, which were subsequently broken down across low (-1 SD), medium (mean), or high (+1 SD) levels of the FI. For every regression model, mean-centered age and years of education variables, and effect-coded sex and cognitive diagnosis (CN/SCD or MCI) variables, were included as covariates. The assumptions of linear regression and outliers were evaluated prior to the fitting of each model using residuals vs fitted, normal Q-Q, scale-location, and residuals vs leverage plots. Outliers in total MBI symptom severity were addressed using 90% winsorization. To account for multiple comparisons, a Bonferroni correction with α = 0.05 and m = 7 resulting in a final statistical significance threshold of p < .007 applied to all regression models. All analyses were conducted on R version 4.0.2 and the emmeans R package was used to generate estimated marginal means for the FI-by-sex interaction.
Results
Participant Characteristics
The final sample included for analysis consisted of 219 participants (49% female) of whom 10 (4.6%) were classified as CN, 48 (21.9%) were diagnosed with SCD, and 161 (73.5%) were diagnosed with MCI. Descriptive summary statistics for participant demographic, frailty, MBI, and neuropsychological measures stratified by sex are shown in Table 1. Collectively, the participant mean and SD for age and education were 72.2 ± 6.5 and 15.8 ± 3.5 years, respectively. When comparing between sexes, males tended to be older, were more likely to be diagnosed with MCI, and reported greater MBI global and apathy symptom presence and severity compared to their female counterparts, on average. Sex differences were not observed for FI values. Participants who were excluded on the basis of missing NPI-Q data did not differ significantly from the final sample in terms of age, sex, education, cognitive diagnosis, or FI values.
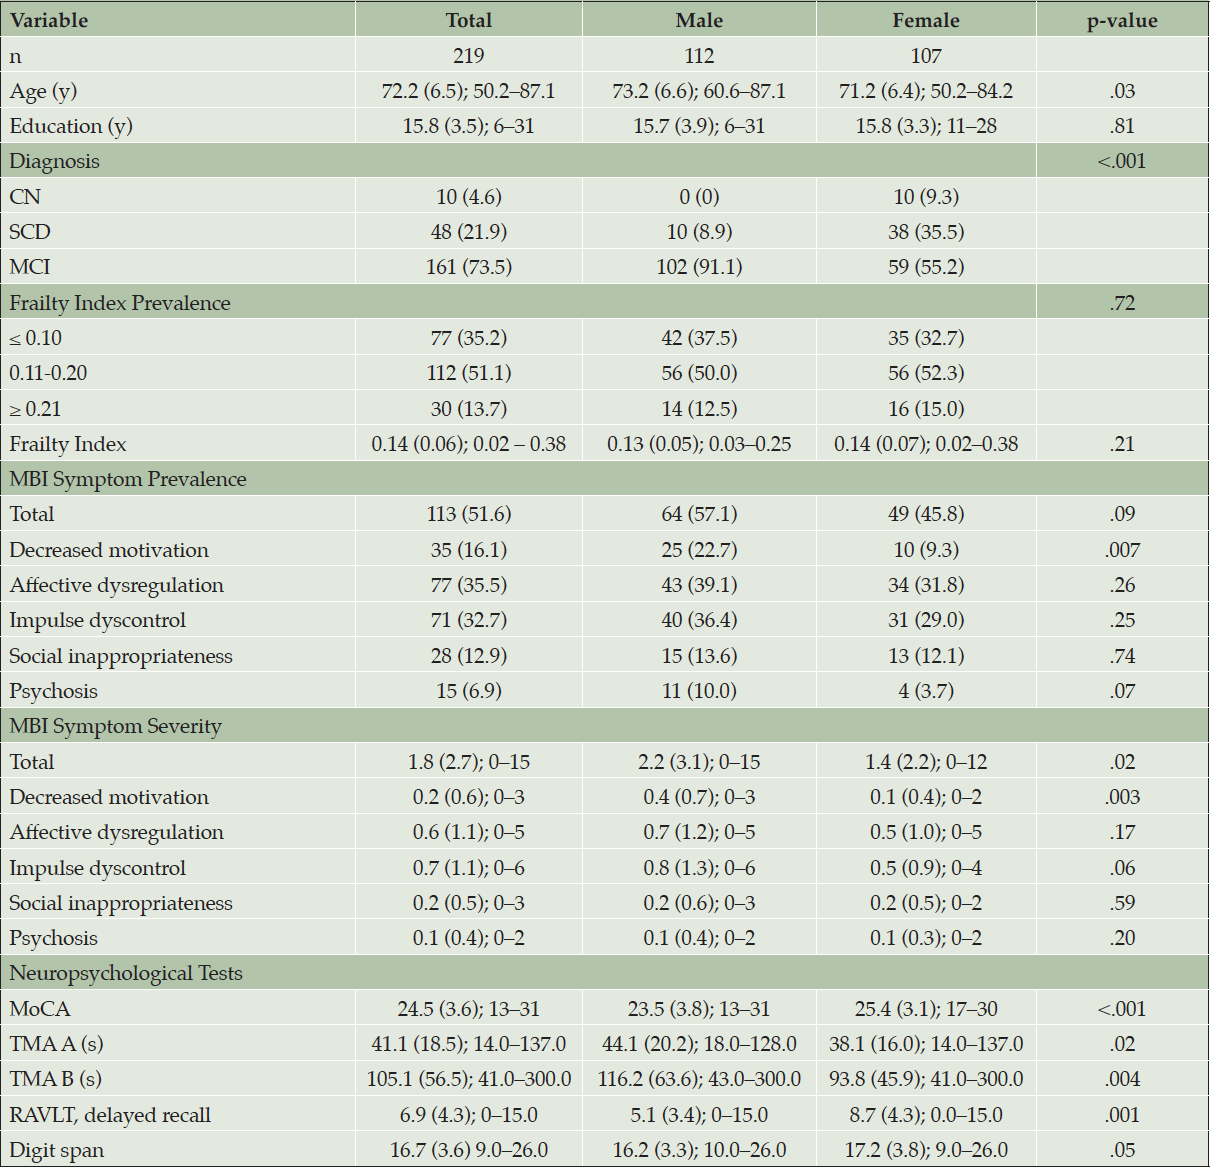
Table 1. Participant Characteristics
Note. Continuous numeric variables are shown in mean (SD); range. Categorical variables are shown in n (%). All values were rounded to the nearest single decimal place except for p- and FI values. p-values correspond to differences between male and female groups and were determined using independent-samples t-tests for continuous variables or chi-square and Fisher’s exact tests, as appropriate, for categorical variables. MBI status was classified using a cut-off score of > 0 to determine MBI prevalence across the entire cohort. FI values range from 0-1 and total MBI symptom severity values range from 0-30. Abbreviations: FI, frailty index; CN, cognitively normal; SCD; subjective cognitive decline; MCI; mild cognitive impairment; MBI, mild behavioral impairment; MoCA, Montreal Cognitive Assessment; TMA A, Trail Making Test A; TMA B, Trail Making Test B; RAVLT, Rey Auditory Verbal Learning Test.
Approximately half (51.1%) of participants had a FI score within 0.11-0.20, 35.2% had a score below 0.10, and 13.7% had a score greater than 0.21. The mean and SD of participant FI scores was 0.14 ± 0.06 (median = 0.14, IQR = 0.09–0.17). MBI symptoms were present in approximately half (51.6%) of participants, and the mean and SD of global MBI symptom severity was 1.8 ± 2.7. The prevalence of MBI symptoms across the FI is shown in Figure 1 and is reported in Table 2. The prevalence of global and domain-specific MBI symptoms were generally highest in those with an FI ≥ 0.21 and lowest in those with an FI ≤ 0.10, with the exception of social inappropriateness which maintained similar prevalence across the FI.
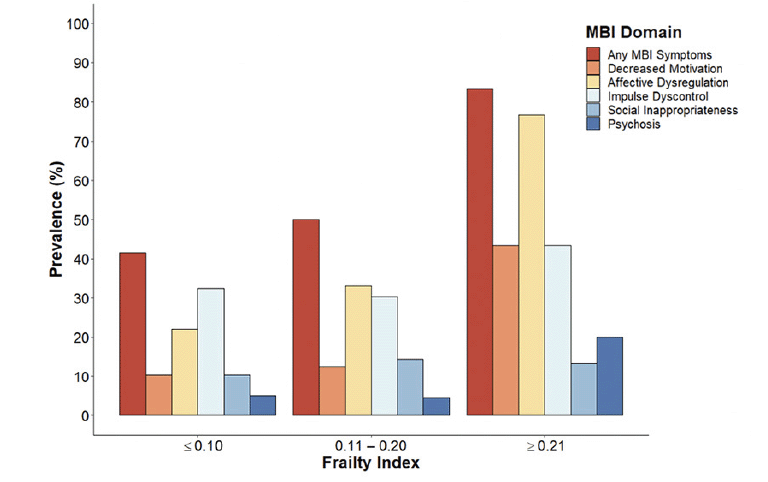
Figure 1. Prevalence of MBI Across the Frailty Index
Values of the FI were categorized into three discrete categories using the following cut-offs: ≤ 0.10 (n = 77), 0.11–0.20 (n = 112), or ≥ 0.21 (n = 30). Participants (total n = 219) were considered to have MBI symptoms based on a cut-off score of >0 in any domain.
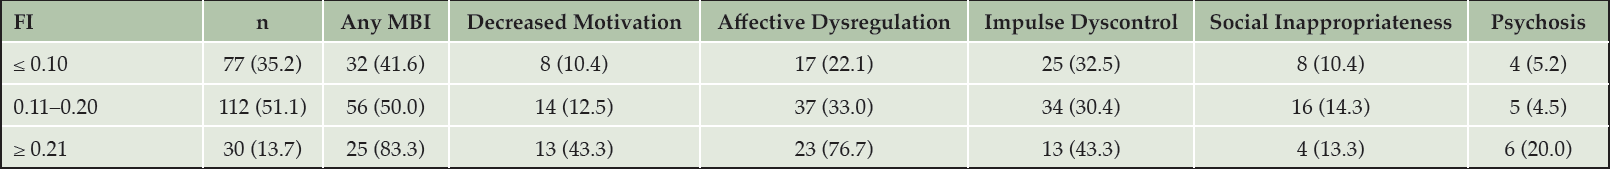
Table 2. Prevalence of MBI Across the Frailty Index
Note. Table values are shown in n (%). Participants (total n = 219) were considered to have MBI symptoms based on a cut-off score of >0 in any domain. Abbreviations: FI, frailty index; MBI, mild behavioral impairment.
Association Between FI and MBI
After adjusting for age, sex, education, and cognitive diagnosis, higher FI values were associated with the presence of MBI symptoms globally and in the domains of decreased motivation, affective dysregulation, and psychosis [Table 3]. The association was the strongest for the affective dysregulation domain such that, for every 0.1 increase in the FI, there was an increase in odds ratio of 4.25 (95% CI 2.32–8.24) for the presence of affective dysregulation symptoms. Likewise, there was an increase in odds ratio of 3.95 (95% CI 1.57–10.80) for the presence of psychosis, 3.14 (95% CI 1.58–6.61) for the presence of decreased motivation, and 2.73 (95% CI 1.54–5.05) for the presence of any MBI symptom, for every 0.1 increase in FI. These associations remained statistically significant after Bonferroni correction. However, FI scores were not associated with the presence of MBI symptoms in the domains of impulse dyscontrol and social inappropriateness.
Higher FI values were also associated with higher MBI total symptom severity [Table 3; Figure 2A]. For every 0.1 increase in the FI, total MBI symptom severity rose by 1.41 (95% CI 0.81–2.01). This association also remained statistically significant after Bonferroni correction. Furthermore, this association was moderated by sex (B = 0.64, 95% CI 0.12–1.15, p = .02) such that it was stronger in males than in females [Figure 2B]. Both sexes reported similar degrees of total MBI symptom severity at low levels of FI (male mean and SE = 0.69 ± 0.31; female mean and SE = 0.76 ± 0.28). However, males reported 1.6 and 1.9 times the total MBI symptom severity of females at medium (male mean and SE = 1.90 ± 0.27; female mean and SE = 1.22 ± 0.21) and high (male mean and SE = 3.12 ± 0.40; female mean and SE = 1.68 ± 0.30) levels of FI, respectively.
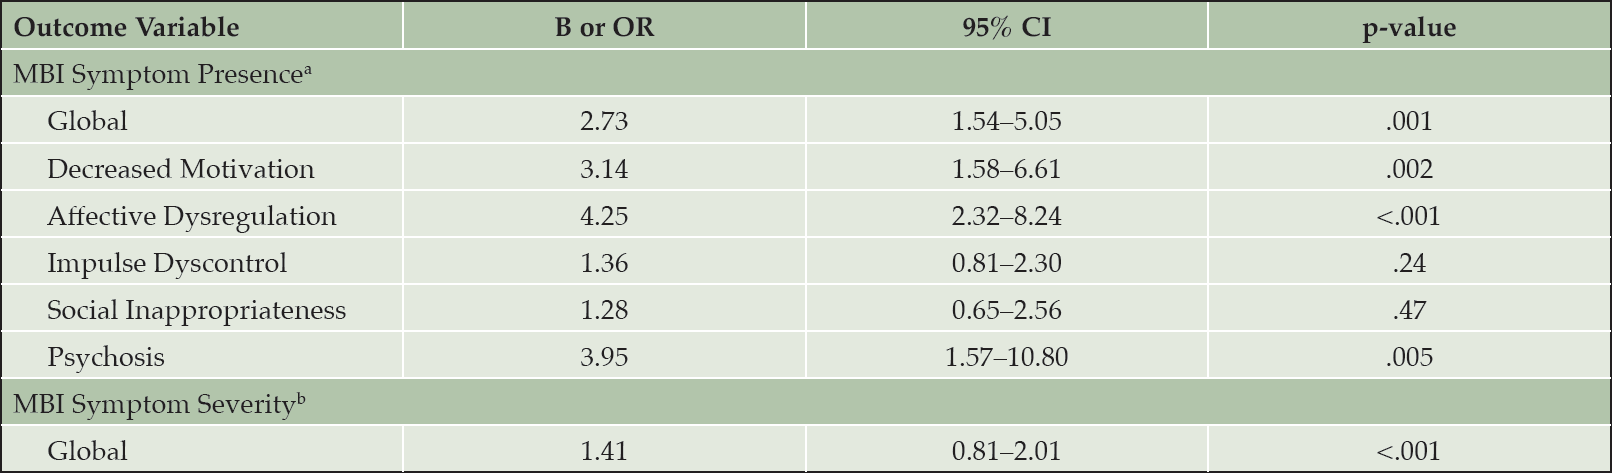
Table 3. Regression Models for the Association Between Frailty Index and MBI
Note. All unstandardized coefficients reported in the table represent change in odds ratio or MBI symptom severity for every 0.1 increase in FI. All regression models controlled for age, sex, education, and cognitive diagnosis. Abbreviations: FI, frailty index; MBI, mild behavioral impairment; OR, odds ratio; CI, confidence interval. a. Multivariable logistic regressions were used to test the association between FI and MBI symptom presence. b. Multivariable linear regressions were used to test the association between FI and MBI symptom severity.
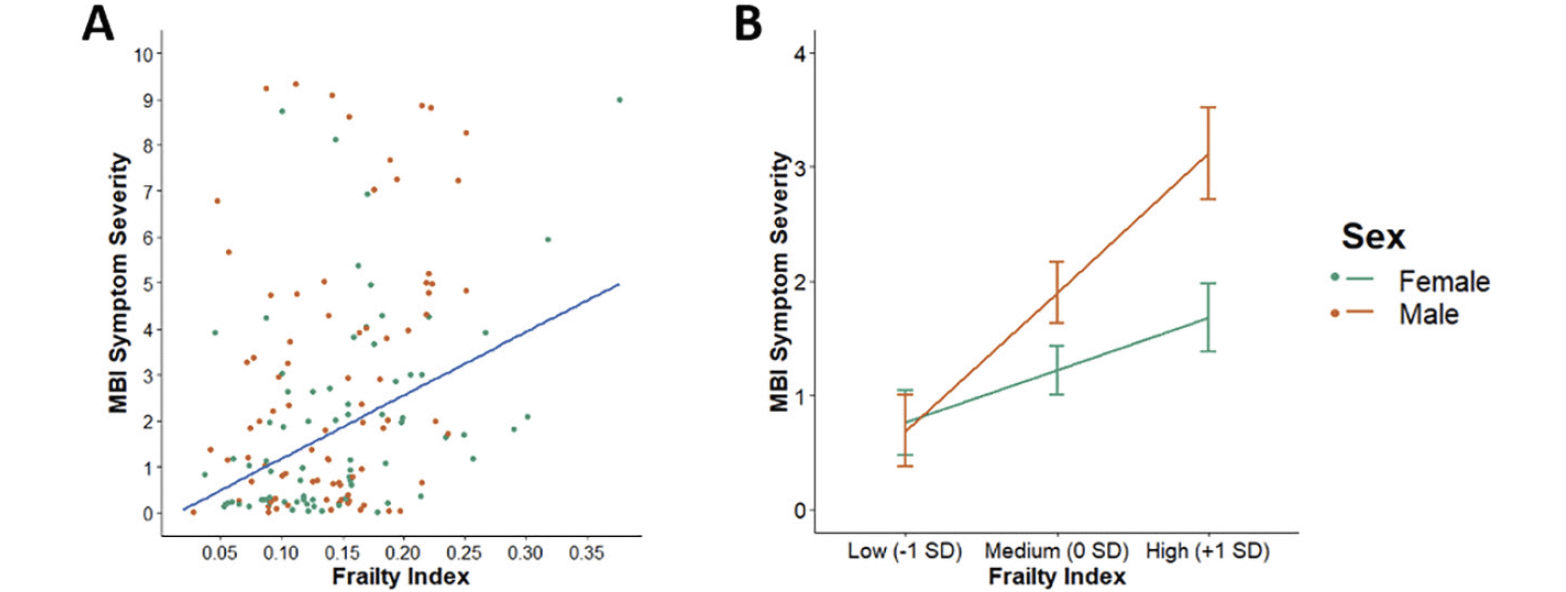
Figure 2. Association Between Frailty Index and MBI Symptom Severity
(A) Scatterplot of the unadjusted association between FI and total MBI symptom severity score. (B) Line plot of the moderating effect of sex on the association between FI and total MBI symptom severity controlling for age, education, and cognitive diagnosis. FI scores for participants (n = 219) were categorized into low (-1 SD), medium (0 SD), or high (+1 SD) levels. Both plots are stratified by sex with females in green (n = 107) and males in orange (n = 112). Abbreviations: FI, frailty index; MBI, mild behavioral impairment.
Discussion
This study demonstrated an association between frailty, measured using a deficit accumulation FI, and the presence and severity of MBI symptoms measured using the NPI-Q in a cohort of 219 pre-dementia participants from the COMPASS-ND study. For every 0.1 unit increase in FI, participants were more likely to report more, and more severe, MBI symptoms. Domain-specific associations were observed, with the FI being the most strongly associated with affective dysregulation, followed by psychosis, and decreased motivation, but not impulse dyscontrol or social inappropriateness. Despite observing no sex differences in FI, a moderating effect of sex on the association between FI and total MBI symptom severity was revealed such that at high levels of FI, males tended to report nearly twice the severity of MBI symptoms than females.
To our knowledge, these findings are consistent with the only other available study to date that characterized the relationship between frailty and MBI, in which older adults with MBI were shown to be more likely to have frailty than those without (31). That study, however, dichotomized participants as having frailty or not using the frailty phenotype which considered only five indicators of frailty. In contrast, our study utilized the FI. The deficit accumulation perspective of frailty has been demonstrated in multiple settings and yields a robust indicator of dementia risk (41). By collapsing dozens of health deficits, the FI is able to capture both traditional and non-traditional dementia factors known to contribute to cognitive decline and dementia risk into single variable. Furthermore, that the ability of the FI to predict dementia is strongest when including both traditional and non-traditional dementia risk markers, suggests that the FI captures more information about dementia risk than the sum of its individual components (45-47). Hence, the FI may be better suited to predict MBI symptoms, which precede and persist through the onset of dementia, than the frailty phenotype. Another difference is that our study modelled MBI as both a categorical and continuous measure. This enabled assessments of not only the relationship between frailty and MBI status but also between frailty and MBI symptom severity. Finally, by investigating the moderating role of sex, we demonstrate the novel finding that males experience nearly twice the burden of MBI symptom severity compared to females at high but not low levels of FI.
This study has several implications regarding the potential for intervention in older adults living with frailty. While these older adults are at greater risk of cognitive decline than their non-frail counterparts (7-9), our findings indicate that people living with frailty may also be at a greater risk of neurobehavioral impairments, especially if they are male. In addition to conferring dementia risk, the NPS that comprise MBI have been associated with greater functional impairment (48), caregiver stress (44, 49), risk of death (50), financial burden (51), earlier institutionalization (52), and poorer quality of life (53). Hence, it may be beneficial to screen older adults with higher FI scores for both cognitive impairment and behavioral or personality change for two reasons. First, to obtain a more comprehensive evaluation of dementia risk (25, 54, 55), and second, to enable potential treatment options for MBI symptoms, which persist and continue to worsen as the disorder progresses. However, where MBI manifests along the temporal spectrum of frailty development and the direction of causality remains unknown. The health deficits that contribute to frailty could contribute to greater MBI symptoms through psychosocial mechanisms such as social isolation and restricted mobility, or more directly by facilitating adverse health events, such as cerebrovascular burden or hypoxia, that impact behavioral symptoms. It is also conceivable that certain aspects of frailty and MBI may also share an underlying etiology involving dementia neuropathologies, resulting in concurrent presentations. For instance, slower gait speed and worse self-reported hearing, which are components of the frailty phenotype and FI, respectively (39), and have been cross-sectionally associated with more severe MBI symptoms in older adults without dementia (28, 29). Finally, MBI symptoms may be present before individuals are clinically classified as frail and could contribute to more severe comorbidities and higher FI scores in a sex-dependent manner. Although much remains unknown about the direction of effect between frailty and MBI and the impacts of treating frailty and MBI on incident cognitive decline and dementia, our findings encourage further research into this area. Addressing the health deficits that characterize frailty may serve to simultaneously reduce MBI symptom severity and dementia risk, and vice versa.
Our moderation findings suggest that MBI could be a potential addition to the male-female health-survival paradox as one of the “lethal” effects of frailty that are more severe in males than in females with equal levels of frailty (32). The observed sex differences in MBI symptoms at high levels of frailty may be explained by a survival effect. That is, females living with more severe frailty and MBI symptoms may be more likely than their male counterparts to have been diagnosed with dementia, thereby excluding them from our non-dementia sample. Consistent with this hypothesis, the incidence and prevalence of AD is higher in females than in males (56), and NPS are more prevalent and severe in females than in males in AD populations (57). Thus, treating the symptoms that contribute to MBI may also be a potential avenue to mitigate dementia risk. Future research utilizing longitudinal designs is necessary to elucidate the temporal patterns and causal mechanisms that underlie this association and whether the observed sex differences can be attributed to survival effects. In addition, it may be worth considering whether MBI symptoms should be included as one of the many health deficits that define frailty in older adults. Existing applications of the FI already contain items pertaining to the clinical diagnosis of psychiatric disorders such as mood disorders and schizophrenia (39), as well as the presence of certain NPS over the last month (5), but not later life and persistent symptoms of MBI that strictly adhere to the diagnostic criteria set by the Alzheimer’s Association International Society to Advance Alzheimer’s Research and Treatment (ISTAART-AA)(16).
The application of the FI designed specifically for the COMPASS-ND cohort is a strength of this study. Because it excluded items related to neurological disorders, this FI was unbiased with regards to associations with neurodegenerative disease symptoms. Furthermore, the FI did not contain any items used to derive MBI so the association between FI and MBI symptom prevalence and severity was not confounded by having shared components used to generate both measures. However, several limitations of this study mean that our findings should be interpreted with caution. The cross-sectional design precludes any insight into the degree of FI at which symptoms of MBI begin to manifest and vice versa. In addition, there were few participants in this cohort who were classified as CN, as the vast majority were classified as MCI. This distribution limited our statistical power for investigating MBI in cognitively unimpaired participants. Similarly, our finding that the FI is associated with and increased risk of MBI symptoms in the abnormal perception or thought content domain should be viewed with caution as few participants showed psychotic symptoms. Finally, the study derived its measure of MBI by transforming NPI-Q scores. While most of the NPI-Q items can be mapped onto one of the five MBI domains, this transformation remains a crude approximation of MBI. The NPI-Q measures symptoms using a timeframe of only one month whereas the ISTAART-AA diagnostic criteria for MBI stipulate that NPS must emerge de novo in later life and persist for over six months before they are considered MBI (16). This is an important distinction that separates MBI, which is thought to manifest as a consequence of underlying dementia neuropathology (58), from other psychiatric disorders or reactions to life stressors (59, 60). To address this limitation, future studies should utilize the MBI Checklist (MBI-C), a validated instrument designed to measure MBI in accordance with the ISTAART-AA MBI diagnostic criteria (61-63).
Conclusion
Frailty measured using the FI is strongly associated with the presence and severity of MBI symptoms in a large pre-dementia cohort, especially for males. Males report nearly twice the severity of MBI symptoms than females at high levels of FI. Older adults who are frail may benefit from assessments of both cognitive and behavioral impairment to further enhance the detection of dementia risk.
Conflicts of Interest: Financial Disclosure: Guan, Smith – no declared conflicts; Ismail – honoraria / consulting fees from Lundbeck/Otsuka, outside the submitted work, consulting fees from Acadia, Biogen, and Roche, all paid to institution. Rockwood – has asserted copyright of the Clinical Frailty Scale through Dalhousie University’s Industry, Liaison, and Innovation Office. Use is free for education, research, and not-for-profit health care. Users agree not to change or commercialize the scale. In addition to academic and hospital appointments, KR is Co-founder of Ardea Outcomes, which (as DGI Clinical) in the last three years has contracts with pharmaceutical and device manufacturers (Danone, Hollister, INmune, Novartis, Takeda) on individualized outcome measurement. In 2020, he attended an advisory board meeting with Nutricia on dementia, and chaired a Scientific Workshop & Technical Review Panel on frailty for the Singapore National Research Foundation. Otherwise, any personal fees are for invited guest lectures, rounds and academic symposia, received directly from event organizers, for presentations on frailty. He is Associate Director of the Canadian Consortium on Neurodegeneration in Aging. The Canadian Consortium on Neurodegeneration in Aging is supported by a grant from the Canadian Institutes of Health Research with funding from several partners.
Author Contributions: Study concept and design: Guan, Ismail. Acquisition of subjects and/or data: Guan. Analysis and interpretation of data: Guan, Rockwood, Ismail. Preparation of manuscript: Guan, Ismail. Critical revision of manuscript: Rockwood, Smith.
Sponsor’s Role: The Canadian Consortium on Neurodegeneration in Aging partly motivated investigation into sex differences but otherwise played no significant role in the study concept and design, analysis and interpretation of data, and preparation of the manuscript. The Canadian Frailty Network did not play any significant role in any of the above.
Funding: This study received funding from Canadian Consortium on Neurodegeneration in Aging and the Canadian Frailty Network as part of the 2021 Summer Student Award. Kenneth Rockwood has asserted copyright of the Clinical Frailty Scale through Dalhousie University’s Industry, Liaison, and Innovation Office. Use is free for education, research, and not-for-profit health care. Users agree not to change or commercialize the scale. In addition to academic and hospital appointments, KR is Co-founder of Ardea Outcomes, which (as DGI Clinical) in the last three years has contracts with pharmaceutical and device manufacturers (Danone, Hollister, INmune, Novartis, Takeda) on individualized outcome measurement. In 2020, he attended an advisory board meeting with Nutricia on dementia, and chaired a Scientific Workshop & Technical Review Panel on frailty for the Singapore National Research Foundation. Otherwise, any personal fees are for invited guest lectures, rounds and academic symposia, received directly from event organizers, for presentations on frailty. He is Associate Director of the Canadian Consortium on Neurodegeneration in Aging, itself funded by the Canadian Institutes for Health Research, the Alzheimer Society of Canada, and several other charities.
Open Access: This article is distributed under the terms of the Creative Commons Attribution 4.0 International License (http://creativecommons.org/licenses/by/4.0/), which permits use, duplication, adaptation, distribution and reproduction in any medium or format, as long as you give appropriate credit to the original author(s) and the source, provide a link to the Creative Commons license and indicate if changes were made.
References
1. Graham WV, Bonito-Oliva A, Sakmar TP. Update on Alzheimer’s Disease Therapy and Prevention Strategies. Annu Rev Med. 2017;68(1):413-430. 10.1146/annurev-med-042915-103753
2. Mortby ME, Black SE, Gauthier S, et al. Dementia clinical trial implications of mild behavioral impairment. Int Psychogeriatr. 2018;30(2):171-175.
3. Ellwood A, Quinn C, Mountain G. Psychological and Social Factors Associated with Coexisting Frailty and Cognitive Impairment: A Systematic Review. Res Aging. 2021:01640275211045603.
4. Carone M, Asgharian M, Jewell NP. Estimating the lifetime risk of dementia in the Canadian elderly population using cross-sectional cohort survival data. J Am Stat Assoc. 2014;109(505):24-35.
5. Ward DD, Wallace LM, Rockwood K. Cumulative health deficits, APOE genotype, and risk for later-life mild cognitive impairment and dementia. J Neurol Neurosurg Psychiatry. 2021;92(2):136-142.
6. Wallace LM, Theou O, Darvesh S, et al. Neuropathologic burden and the degree of frailty in relation to global cognition and dementia. Neurology. 2020;95(24):e3269-e3279.
7. Kojima G, Taniguchi Y, Iliffe S, Walters K. Frailty as a predictor of Alzheimer disease, vascular dementia, and all dementia among community-dwelling older people: a systematic review and meta-analysis. J Am Med Dir Assoc. 2016;17(10):881-888.
8. Borges MK, Canevelli M, Cesari M, Aprahamian I. Frailty as a predictor of cognitive disorders: a systematic review and meta-analysis. Front Med. 2019;6:26.
9. Grande G, Haaksma ML, Rizzuto D, et al. Co-occurrence of cognitive impairment and physical frailty, and incidence of dementia: Systematic review and meta-analysis. Neurosci Biobehav Rev. 2019;107:96-103.
10. Clegg A, Young J, Iliffe S, Rikkert MO, Rockwood K. Frailty in elderly people. Lancet. 2013;381(9868):752-762.
11. Mitnitski AB, Mogilner AJ, Rockwood K. Accumulation of deficits as a proxy measure of aging. Sci World J. 2001;1:323-336.
12. Fried LP, Tangen CM, Walston J, et al. Frailty in older adults: evidence for a phenotype. J Geron A Biol Sci Med Sci. 2001;56(3):M146-M157.
13. Gauthier S, Reisberg B, Zaudig M, et al. Mild cognitive impairment. Lancet. 2006;367(9518):1262-1270. https://doi.org/10.1016/S0140-6736(06)68542-5
14. Storandt M, Grant EA, Miller JP, Morris JC. Rates of progression in mild cognitive impairment and early Alzheimer’s disease. Neurology. 2002;59(7):1034. 10.1212/WNL.59.7.1034
15. Boyle PA, Yu L, Leurgans SE, et al. Attributable risk of Alzheimer’s dementia attributed to age-related neuropathologies. Ann Neurol. 2019;85(1):114-124. https://doi.org/10.1002/ana.25380
16. Ismail Z, Smith EE, Geda Y, et al. Neuropsychiatric symptoms as early manifestations of emergent dementia: Provisional diagnostic criteria for mild behavioral impairment. Alzheimers Dement. 2016;12(2):195-202. https://doi.org/10.1016/j.jalz.2015.05.017
17. Creese B, Ismail Z. Mild behavioral impairment: measurement and clinical correlates of a novel marker of preclinical Alzheimer’s disease. Alzheimers Res Ther. 2022;14(2):1-5. 10.1186/s13195-021-00949-7
18. Creese B, Brooker H, Ismail Z, et al. Mild Behavioral Impairment as a Marker of Cognitive Decline in Cognitively Normal Older Adults. Am J Geriatr Psychiatry. 2019;27(8):823-834. https://doi.org/10.1016/j.jagp.2019.01.215
19. Ismail Z, McGirr A, Gill S, Hu S, Forkert ND, Smith EE. Mild Behavioral Impairment and Subjective Cognitive Decline Predict Cognitive and Functional Decline. J Alzheimers Dis. 2021;80(1):459-469.
20. Wise EA, Rosenberg PB, Lyketsos CG, Leoutsakos J-M. Time course of neuropsychiatric symptoms and cognitive diagnosis in National Alzheimer’s Coordinating Centers volunteers. Alzheimers Dement (Amst). 2019;11:333-339. https://doi.org/10.1016/j.dadm.2019.02.006
21. McGirr A, Nathan S, Ghahremani M, Gill S, Smith EE, Ismail Z. Progression to dementia or reversion to normal cognition in mild cognitive impairment as a function of late-onset neuropsychiatric symptoms. Neurology. 2022; DOI: 10.1212/WNL.0000000000200256.
22. Miao R, Chen H-Y, Gill S, Naude J, Smith EE, Ismail Z. Plasma β-Amyloid in Mild Behavioural Impairment – Neuropsychiatric Symptoms on the Alzheimer’s Continuum. J Geriatr Psychiatry Neurol. 2021:08919887211016068. 10.1177/08919887211016068
23. Johansson M, Smith R, Stomrud E, et al. Mild behavioral impairment is predictive of tau deposition in the earliest stages of Alzheimer’s disease. Alzheimers Dement. 2020;16(S6):e042595. https://doi.org/10.1002/alz.042595
24. Lussier FZ, Pascoal TA, Chamoun M, et al. Mild behavioral impairment is associated with β-amyloid but not tau or neurodegeneration in cognitively intact elderly individuals. Alzheimers Dement. 2020;16(1):192-199. https://doi.org/10.1002/alz.12007
25. Montero-Odasso M, Pieruccini-Faria F, Ismail Z, et al. CCCDTD5 recommendations on early non cognitive markers of dementia: A Canadian consensus. Alzheimers Dement (N Y). 2020;6(1):e12068. https://doi.org/10.1002/trc2.12068
26. Ismail Z, Black SE, Camicioli R, et al. Recommendations of the 5th Canadian Consensus Conference on the diagnosis and treatment of dementia. Alzheimers Dement. 2020;16(8):1182-1195. 10.1002/alz.12105
27. Gauthier S, Rosa-Neto P, Morais J, Webster C. World Alzheimer Report 2021: Journey through the diagnosis of dementia. Alzheimer’s Disease International: London, UK. 2021.
28. Guan DX, Chen HY, Camicioli R, Montero-Odasso M, Smith EE, Ismail Z. Dual-task gait and mild behavioral impairment: Findings on the interface between non-cognitive dementia markers in the COMPASS-ND study. Exp Gerontol. 2022 Jun 1;162:111743. doi: 10.1016/j.exger.2022.111743. Epub 2022 Feb 16. PMID: 35182610.
29. Gosselin P, Guan D, Chen H-Y, et al. The Relationship Between Hearing and Mild Behavioral Impairment and the Influence of Sex: A Study of Older Adults Without Dementia from the COMPASS-ND Study. J Alzheimers Dis Rep. 2022 Feb 18;6(1):57-66. doi: 10.3233/ADR-210045.
30. Gosselin PA, Ismail Z, Faris PD, et al. Effect of hearing ability and mild Behavioural impairment on MoCA and memory index scores. Can Geriatr J. 2019;22(3):165.
31. Fan S, Liang X, Yun T, et al. Mild behavioral impairment is related to frailty in non-dementia older adults: a cross-sectional study. BMC Geriatr. 2020;20(1):1-9.
32. Gordon EH, Peel NM, Samanta M, Theou O, Howlett SE, Hubbard RE. Sex differences in frailty: A systematic review and meta-analysis. Exp Gerontol. 2017;89:30-40. https://doi.org/10.1016/j.exger.2016.12.021
33. Hubbard RE, Rockwood K. Frailty in older women. Maturitas. 2011;69(3):203-207.
34. Mortby ME, Ismail Z, Anstey KJ. Prevalence estimates of mild behavioral impairment in a population-based sample of pre-dementia states and cognitively healthy older adults. Int Psychogeriatr. 2018;30(2):221-232.
35. Geda YE, Roberts RO, Mielke MM, et al. Baseline neuropsychiatric symptoms and the risk of incident mild cognitive impairment: a population-based study. Am J Psychiatry. 2014;171(5):572-581.
36. Wolfova K, Creese B, Aarsland D, et al. Sex differences in the association of mild behavioral impairment with cognitive aging. medRxiv. 2021.
37. Chertkow H, Borrie M, Whitehead V, et al. The Comprehensive Assessment of Neurodegeneration and Dementia: Canadian Cohort Study. Can J Neurol Sci. 2019;46(5):499-511. 10.1017/cjn.2019.27
38. Smith EE, Duchesne S, Gao F, et al. Vascular Contributions to Neurodegeneration: Protocol of the COMPASS-ND Study. Can J Neurol Sci. 2021:1-8. 10.1017/cjn.2021.19
39. Burt JR, Godin J, Filion J, et al. Frailty prevalence in the COMPASS-ND study of neurodegenerative disorders. Can Geriatr J. 2019;22(4):205.
40. Howlett SE, Rutenberg AD, Rockwood K. The degree of frailty as a translational measure of health in aging. Nat Aging. 2021;1(8):651-665.
41. Rockwood K, Howlett SE. Age-related deficit accumulation and the diseases of ageing. Mech Ageing Dev. 2019;180:107-116. https://doi.org/10.1016/j.mad.2019.04.005
42. Bartley MM, Geda YE, Christianson TJH, Shane Pankratz V, Roberts RO, Petersen RC. Frailty and Mortality Outcomes in Cognitively Normal Older People: Sex Differences in a Population-Based Study. J Am Geriatr Soc. 2016;64(1):132-137. https://doi.org/10.1111/jgs.13821
43. Kaufer DI, Cummings JL, Ketchel P, et al. Validation of the NPI-Q, a Brief Clinical Form of the Neuropsychiatric Inventory. J Neuropsychiatry Clin Neurosci. 2000;12(2):233-239. 10.1176/jnp.12.2.233
44. Sheikh F, Ismail Z, Mortby ME, et al. Prevalence of mild behavioral impairment in mild cognitive impairment and subjective cognitive decline, and its association with caregiver burden. Int Psychogeriatr. 2018;30(2):233-244. 10.1017/S104161021700151X
45. Song X, Mitnitski A, Rockwood K. Nontraditional risk factors combine to predict Alzheimer disease and dementia. Neurology. 2011;77(3):227-234.
46. Song X, Mitnitski A, Rockwood K. Age-related deficit accumulation and the risk of late-life dementia. Alzheimers Res Ther. 2014;6(5):1-13.
47. Kelaiditi E, Canevelli M, Andrieu S, et al. Frailty Index and Cognitive Decline in Alzheimer’s Disease: Data from the Impact of Cholinergic Treatment US e Study. J Am Geriatr Soc. 2016;64(6):1165-1170.
48. Lyketsos CG, Steele C, Baker L, et al. Major and minor depression in Alzheimer’s disease: prevalence and impact. J Neuropsychiatry Clin Neurosci. 1997;9(4):556-561.
49. Fischer CE, Ismail Z, Schweizer TA. Impact of neuropsychiatric symptoms on caregiver burden in patients with Alzheimer’s disease. Neurodegener Dis Manag. 2012;2(3):269-277.
50. Peters ME, Schwartz S, Han D, et al. Neuropsychiatric symptoms as predictors of progression to severe Alzheimer’s dementia and death: the Cache County Dementia Progression Study. Am J Psychiatry. 2015;172(5):460-465.
51. Murman DL, Chen Q, Powell M, Kuo S, Bradley C, Colenda C. The incremental direct costs associated with behavioral symptoms in AD. Neurology. 2002;59(11):1721-1729.
52. Steele C, Rovner B, Chase GA, Folstein M. Psychiatric symptoms and nursing home placement of patients with Alzheimer’s disease. Am J Psychiatry. 1990;147(8):1049-1051.
53. González-Salvador T, Lyketsos CG, Baker A, et al. Quality of life in dementia patients in long-term care. Int J Geriatr Psychiatry. 2000;15(2):181-189.
54. Ismail Z, Black SE, Camicioli R, et al. Recommendations of the 5th Canadian Consensus Conference on the diagnosis and treatment of dementia. Alzheimers Dement. 2020;16(8):1182-1195.
55. Tang-Wai DF, Smith EE, Bruneau MA, et al. CCCDTD5 recommendations on early and timely assessment of neurocognitive disorders using cognitive, behavioral, and functional scales. Alzheimers Dement (N Y). 2020;6(1):e12057.
56. Mielke MM, Vemuri P, Rocca WA. Clinical epidemiology of Alzheimer’s disease: assessing sex and gender differences. Clin Epidemiol. 2014;6:37.
57. Eikelboom WS, Pan M, Ossenkoppele R, et al. Sex differences in neuropsychiatric symptoms in Alzheimer’s disease dementia: A meta-analysis. Alzheimers Dement. 2021;17:e055542.
58. Ruthirakuhan M, Ismail Z, Herrmann N, Gallagher D, Lanctot KL. Mild behavioral impairment is associated with progression to Alzheimer’s disease: A clinicopathological study. Alzheimers Dement. 2022. 10.1002/alz.12519
59. Taragano FE, Allegri RF, Heisecke SL, et al. Risk of Conversion to Dementia in a Mild Behavioral Impairment Group Compared to a Psychiatric Group and to a Mild Cognitive Impairment Group. J Alzheimers Dis. 2018;62:227-238. 10.3233/JAD-170632
60. Matsuoka T, Ismail Z, Narumoto J. Prevalence of Mild Behavioral Impairment and Risk of Dementia in a Psychiatric Outpatient Clinic. J Alzheimers Dis. 2019;70:505-513. 10.3233/JAD-190278
61. Ismail Z, Agüera-Ortiz L, Brodaty H, et al. The Mild Behavioral Impairment Checklist (MBI-C): a rating scale for neuropsychiatric symptoms in pre-dementia populations. J Alzheimers Dis. 2017;56(3):929-938.
62. Mallo SC, Ismail Z, Pereiro AX, et al. Assessing Mild Behavioral Impairment with the Mild Behavioral Impairment-Checklist in People with Mild Cognitive Impairment. J Alzheimers Dis. 2018;66:83-95. 10.3233/JAD-180131
63. Mallo SC, Ismail Z, Pereiro AX, et al. Assessing mild behavioral impairment with the mild behavioral impairment checklist in people with subjective cognitive decline. Int Psychogeriatr. 2019;31(2):231-239. http://dx.doi.org/10.1017/S1041610218000698